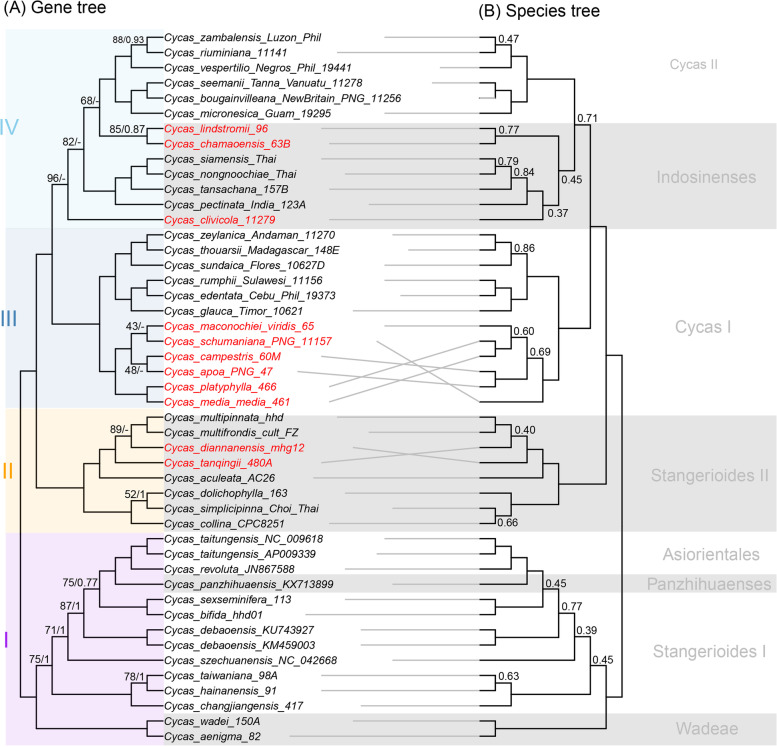
Fig. 4.
Comparison of tanglegram of Cycas based on plastid protein-encoding genes. a Maximum likelihood cladogram of Cycas based on concatenated genes using IQTREE. Maximum likelihood bootstrap (BS) values and the Posterior Probabilities (PP) calculated from MrBayes are shown at nodes respectively, except nodes with 100% (BS) and 1.0 (PP), ‘-’ indicates no support value. b Cladogram generated by the coalescent method in ASTRAL-III. Numbers on the branches depict Local posterior probabilities (LPP), with LPP below 0.9 not shown. Conflicted lineages are highlighted in red font. The highlighted clades I-IV on the left are correspond to Fig. 3 and the subclades corresponded to morphological classification are indicated on the right

