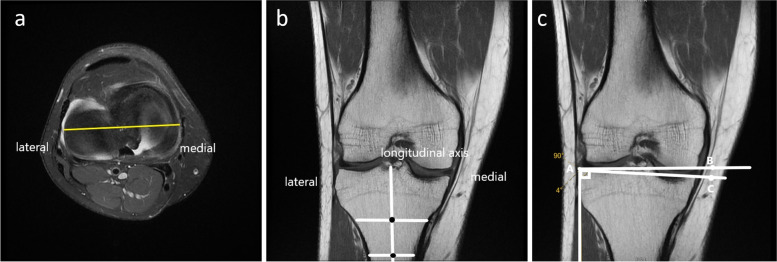
Fig. 2.
Illustration of coronal tibial slope measurement on T1 MRI sequence. a Axial plane through the tibiofemoral joint showing the top view of the tibial plateau. The yellow line represents the coronal plane that passed closest to the centroid of the tibial plateau. b Using the coronal view, two lines are drawn across the lateral and medial sides. The coronal longitudinal axis was determined by having a line connecting these two midpoints. c The coronal tibial slope was formed as an angle measured by a line drawn along the peak points on the medial and lateral aspects of the plateau and the line perpendicular to the coronal longitudinal (tibial) axis

