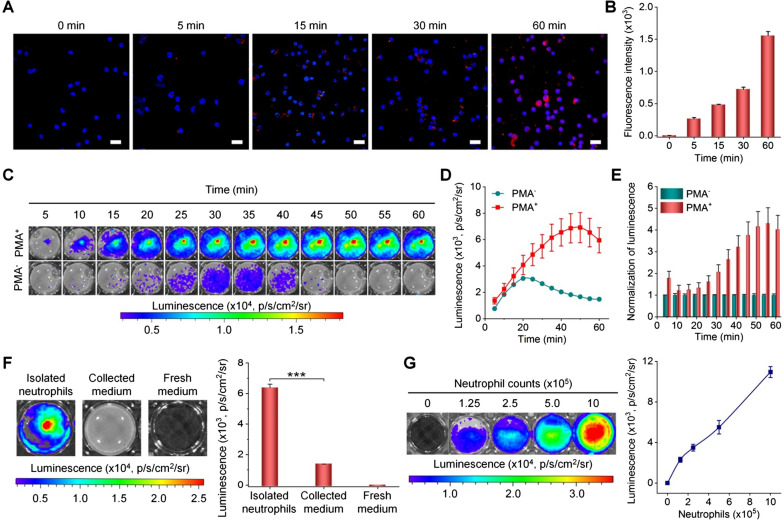
Fig. 4.
In vitro luminescence imaging of neutrophils with LAD NPs. A, B Confocal microscopy images (A) and flow cytometric analysis (B) showing time-dependent uptake of LAD NPs in peritoneal neutrophils. Nuclei were stained with DAPI. Scale bars, 20 μm. C, D Typical time-resolved images (C) and quantitative analysis (D) of luminescence signals in neutrophils treated with LAD NPs. Neutrophils (5 × 10⁵ cells per well) with (PMA+) or without (PMA−) stimulation with phorbol 12-myristate 13-acetate for 1 h were incubated with 3 mg/mL LAD NPs, followed by imaging at predetermined time points. E Normalized luminescence intensities in neutrophils. F Quantification of intracellular or extracellular luminescence intensities after neutrophils were incubated with 3 mg/mL LAD NPs for 1 h. G Luminescence intensities of different numbers of neutrophils immediately after incubation with 3 mg/mL LAD NPs. In both cases, the left panels show representative luminescence images, while the right panels denote quantitative data. Data are expressed as means ± SD (n = 3). ***P < 0.001

