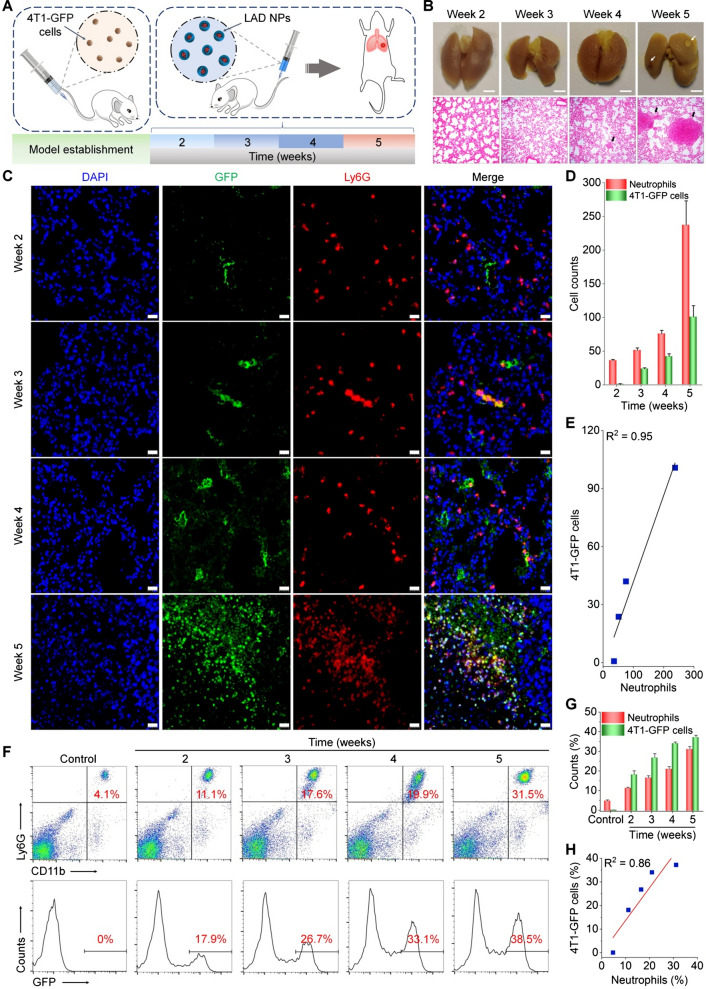
Fig. 5.
Correlation analyses of neutrophil and tumor cell counts in the lungs of mice subjected to intravenous inoculation with 4T1-GFP tumor cells. A Schematic illustration of experimental regimens. B Digital photos (upper) and microscopic images of H&E-stained histological sections of lungs (lower) at different time points after intravenous inoculation of 4T1-GFP tumor cells. Scale bars, 2 mm. Both white and black arrows indicate metastatic pulmonary nodules. C Immunofluorescence analyses of GFP-positive tumor cells (green) and Ly6G-positive neutrophils (red) in lung tissues of mice. Scale bars, 20 μm. D Quantitative analysis of the counts of 4T1-GFP tumor cells and neutrophils. E Correlation analysis of tumor cell and neutrophil counts in the lungs. F Representative flow cytometric profiles showing neutrophils (upper) and 4T1-GFP tumor cells (lower) in lung tissues. G, H Quantified cell populations of neutrophils and tumor cells by flow cytometry (G) and their correlation analysis (H). Data are expressed as means ± SD (D, n = 4; G, n = 5)

