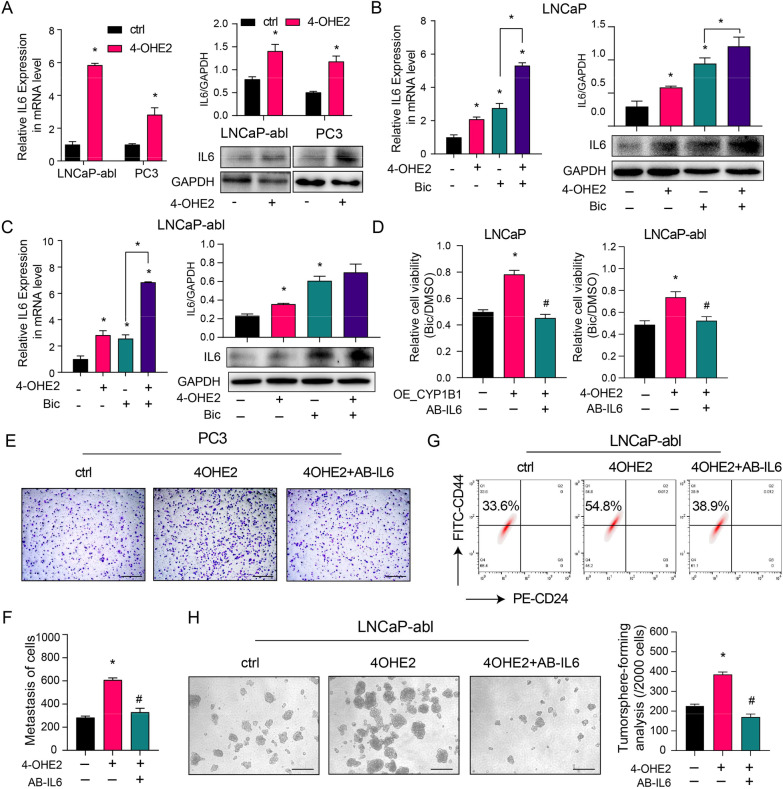
Fig. 4.
4-OHE2 promotes PCSC characteristics by upregulating IL6 expression. A The mRNA (left) and protein (right) levels of IL6 in LNCaP-abl and PC3 cells treated with 4-OHE2 (t-test). B–C The mRNA (left) and protein (right) levels of IL6 in LNCaP (B) and LNCaP-abl (C) cells after the indicated treatments (one-way ANOVA). D Cell viability was assayed in LNCaP (left) and LNCaP-abl (right) cells after the indicated treatments (one-way ANOVA). E–F, (E) The cell invasion capability was assayed in PC3 cells after the indicated treatments. (F) Quantitative result of the (E) (one-way ANOVA). Scale bar = 500 μm. G A representative flow cytometric analysis of the CD44+/CD24− subpopulation of LNCaP-abl cells treated with 4-OHE2 and/or AB-IL6. H Representative image (left) and quantification (right) of tumorsphere formation assay from LNCaP-abl cells treated with 4-OHE2 and/or AB-IL6. Scale bar = 100 μm (one-way ANOVA). Bic, bicalutamide; AB-IL6, IL6 neutralizing antibody. All values represent the means ± SD from three independent experiments. *p < 0.05 versus ctrl. #p < 0.05 versus 4-OHE2 or OE_CYP1B1

