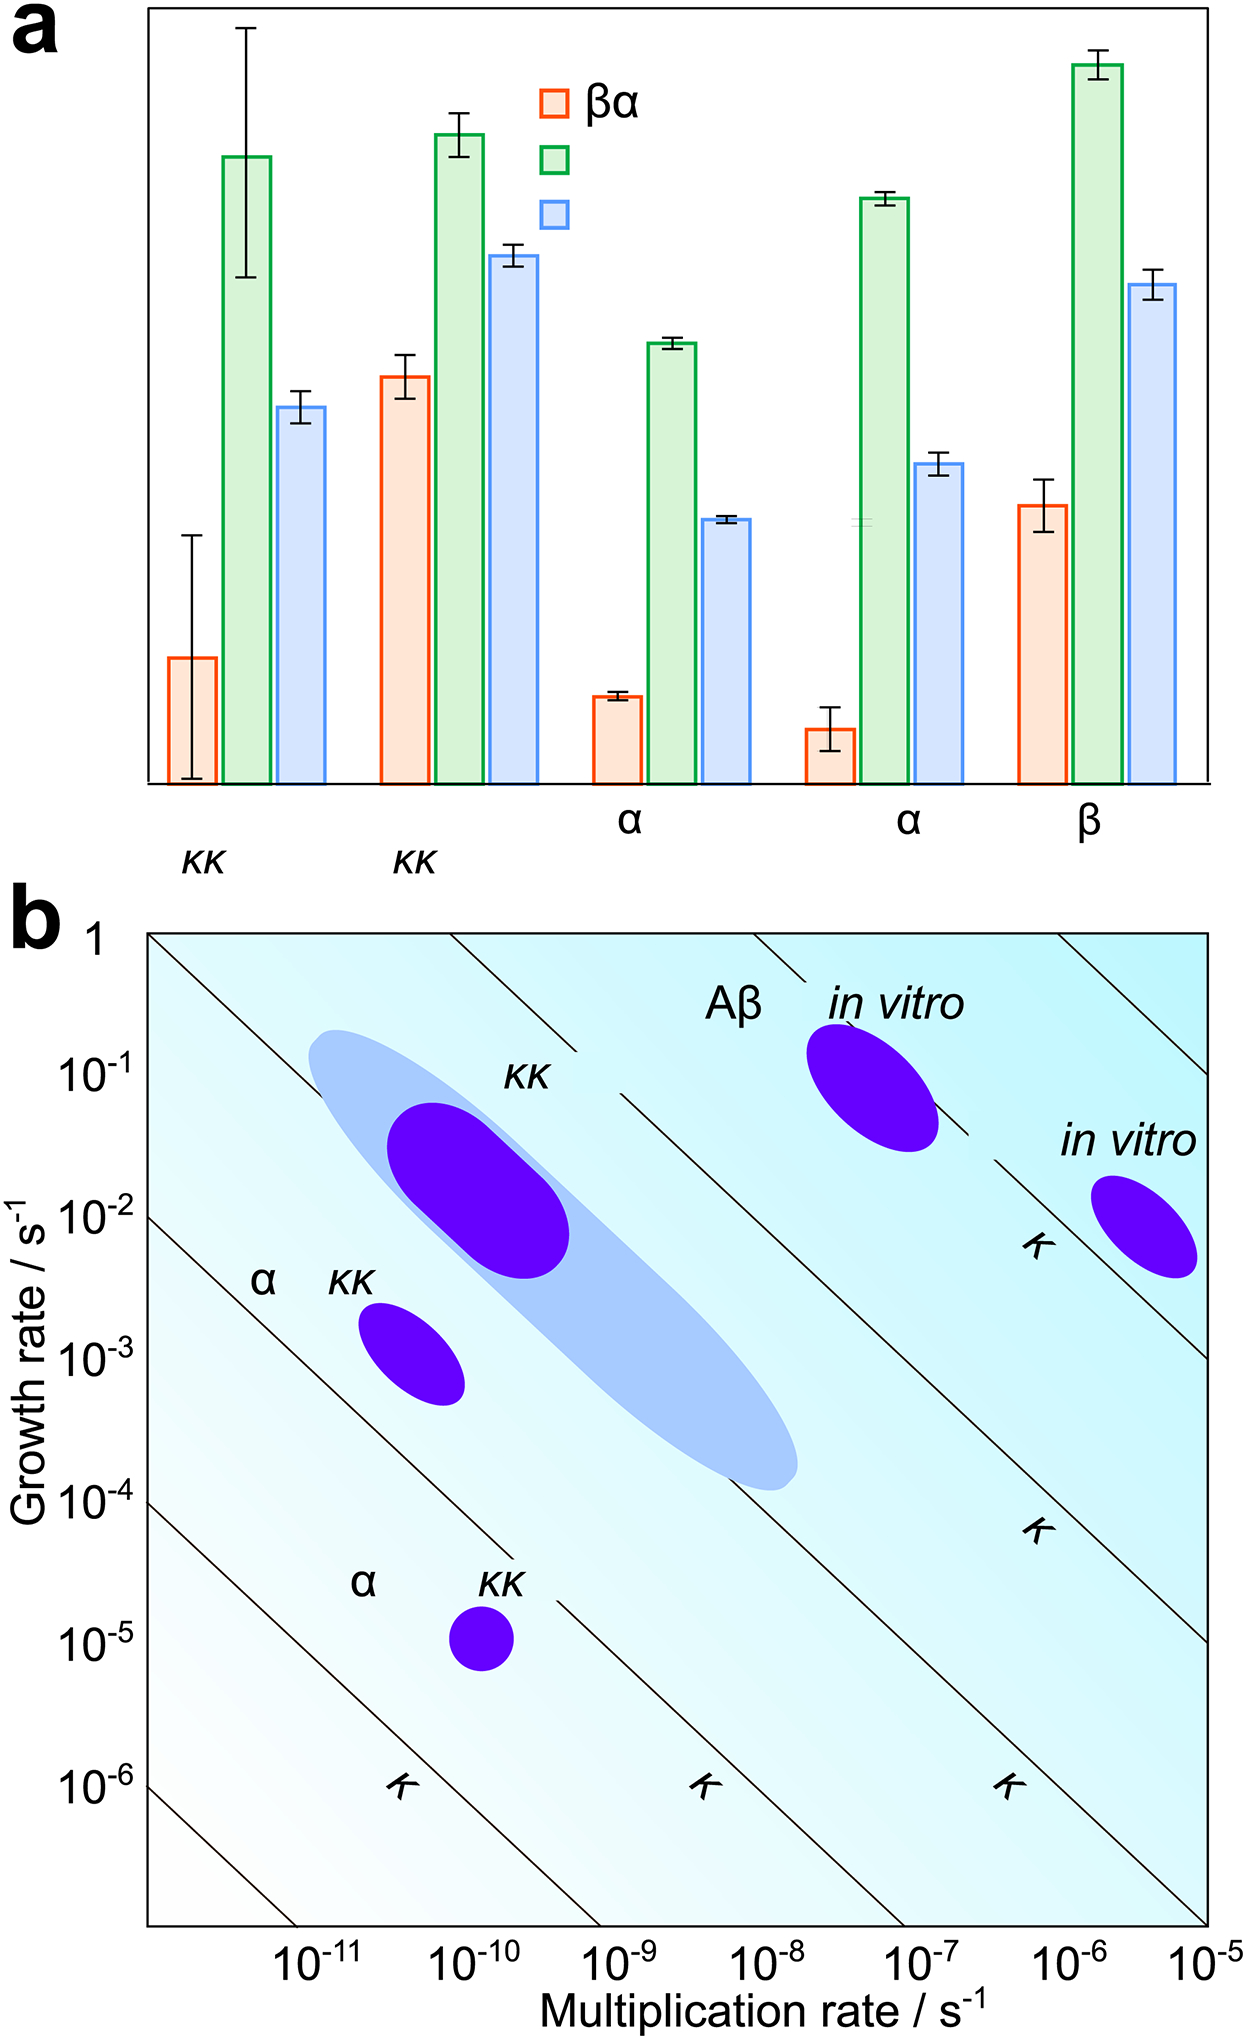
Figure 6: Individual rates in vivo and in vitro.

(a) Rates of growth, multiplication and overall replication for prions in tga20 mice and a range of other in vitro systems. (b) A two-dimensional visualization of the values obtained in (a). The growth rate is plotted against the multiplication rate, lines of constant replication rate are shown as diagonals. For prions in vivo, the rates obtained assuming prions are elongated structures and consist between 3000 and 30000 PrP monomers are shown in dark blue, the bounds obtained without these assumptions are shown in light blue. For both panels, the rate constants and error bars were obtained: for in vitro PrP and α-synuclein from Sang et al. (42), for tau from Kundel et al. (49), and for Aβ42 from Meisl et al. (50). The growth and replication rates for the in vitro systems were then calculated at a monomer concentration of 135 nM, which is the concentration of PrPC in tga20 mice. The error bars for the replication rate of in vivo prions are the range of rates obtained from the different analysis methods and different datasets, the error bars for multiplication and growth are the upper and lower bounds on the average aggregate size (see Supplementary Notes 4 and 5). The height of the bars in (a) is chosen to lie halfway between these bounds. Data behind graphs are available online as Source Data.
