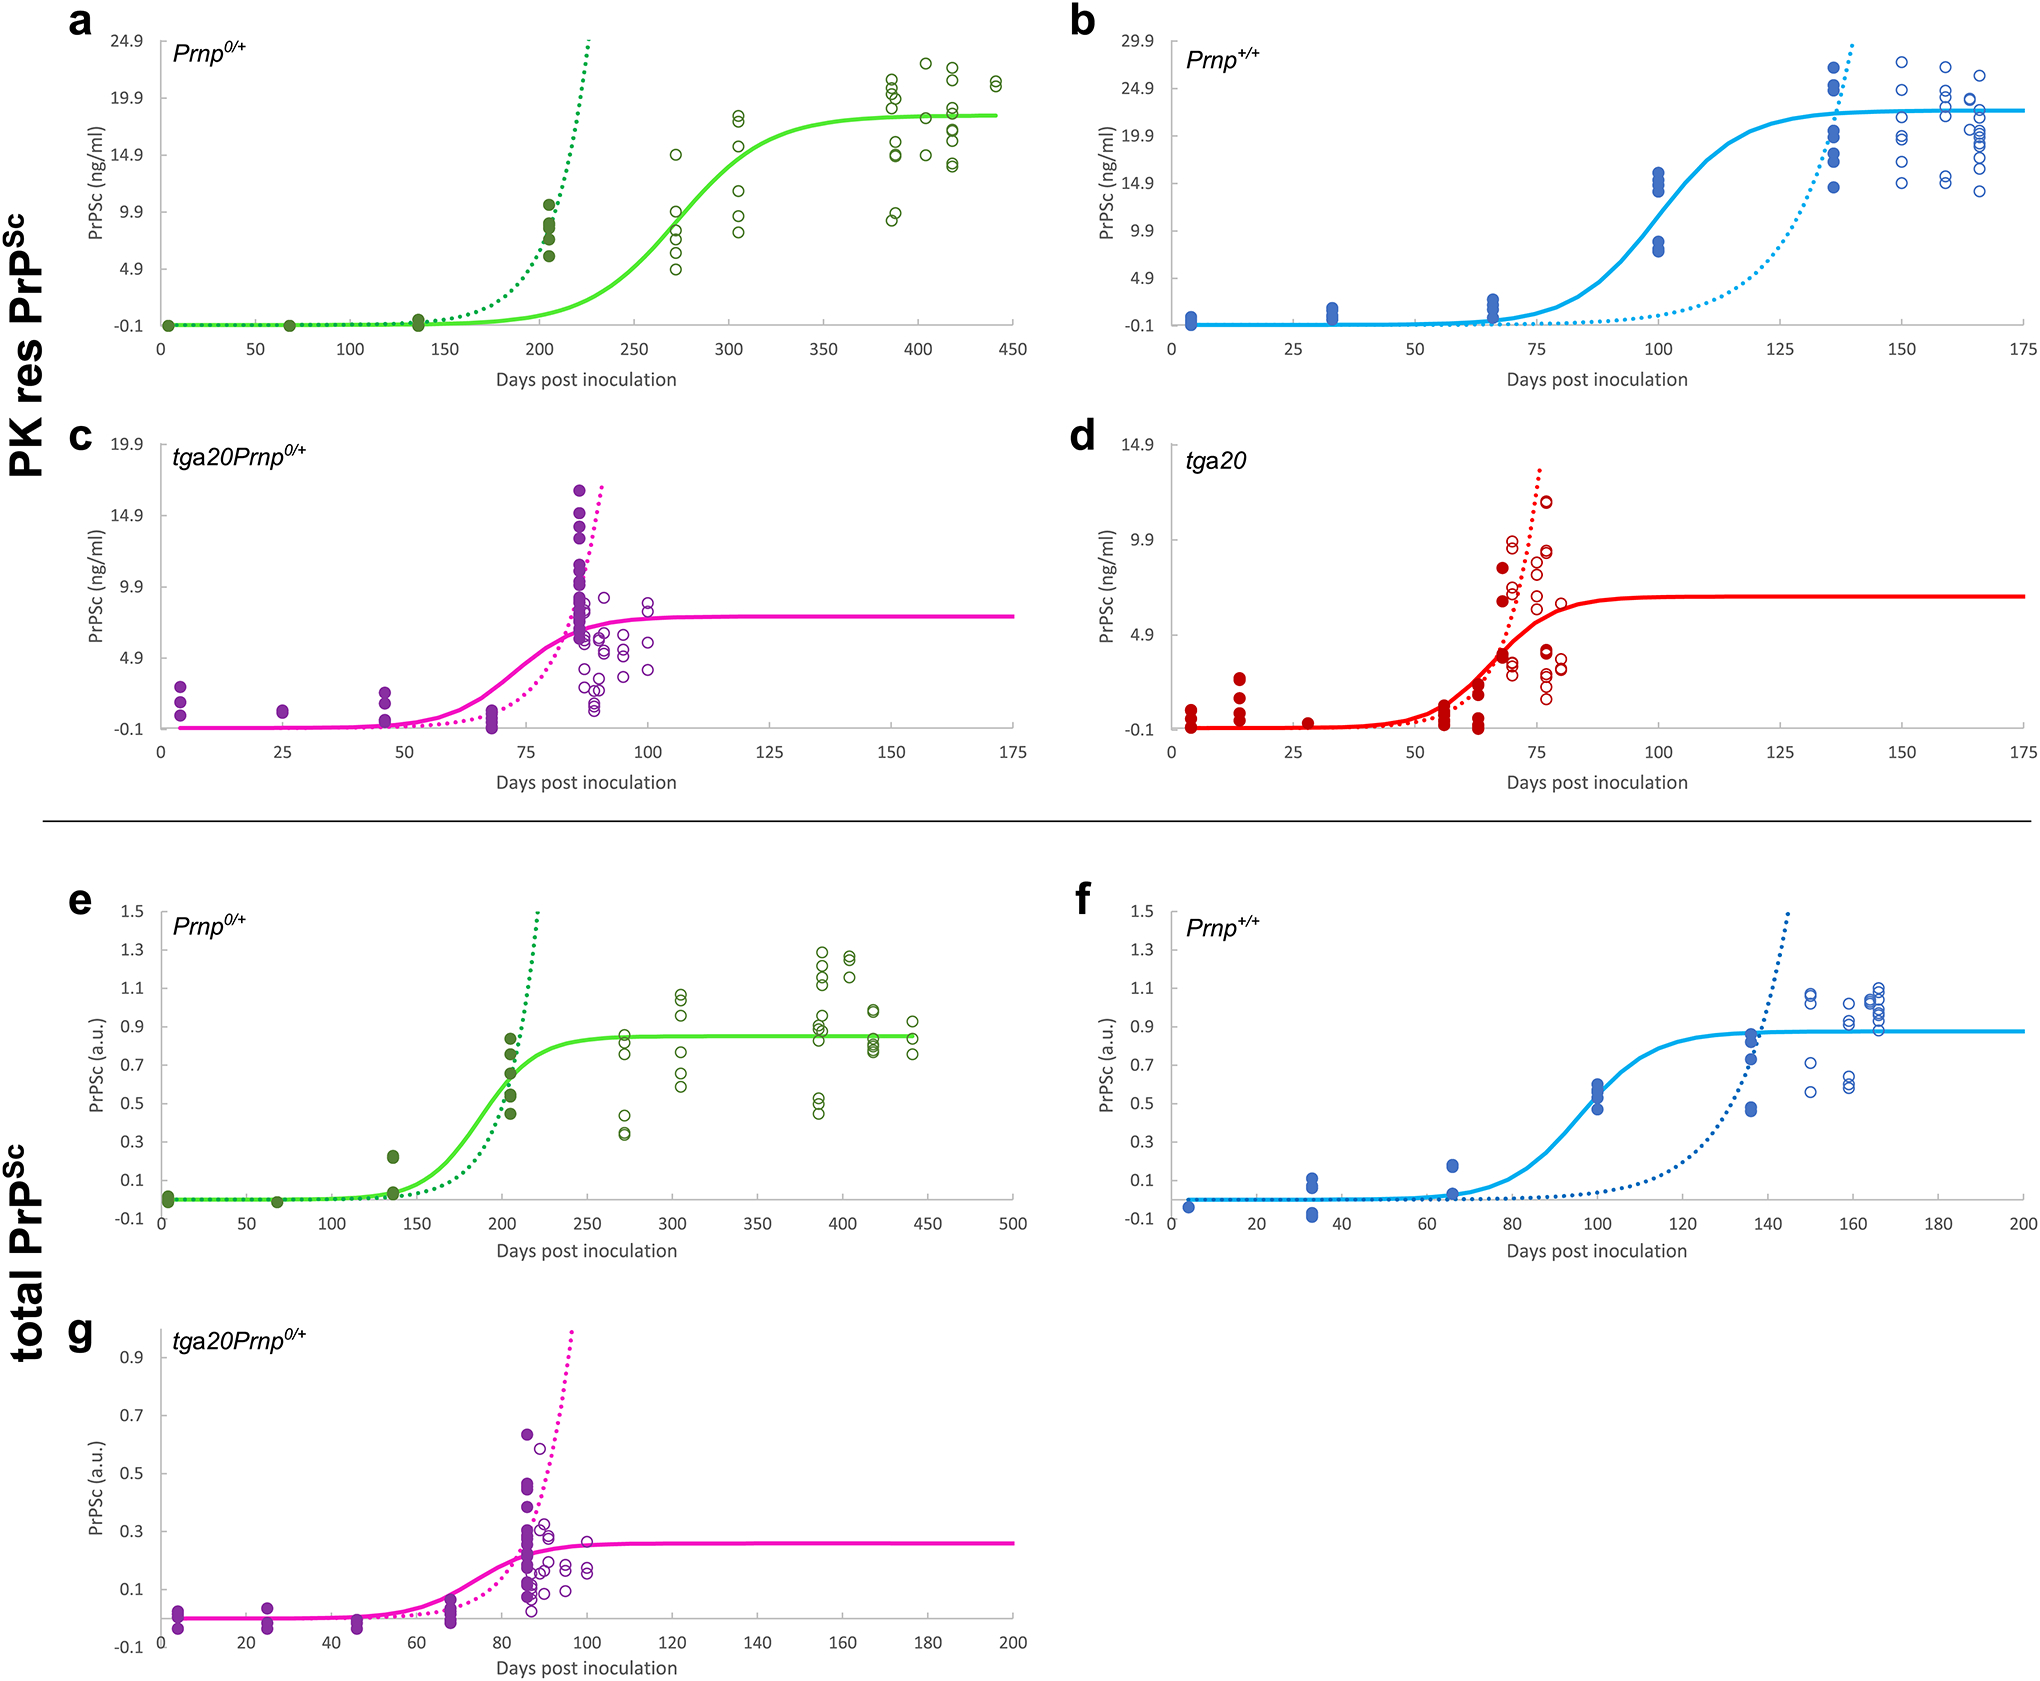
Extended Data Fig. 2. Sigmoidal and exponential fits of PrPSc measurements obtained here.

Data as shown in the main text (a-d), as well as the data obtained without PK digestion (e-g), fitted to both a sigmoidal function (solid line) and a simple exponential (dotted line). All data points (filled and open circles) are used in the sigmoidal fits, only pre-plateau data points (filled circles) are used in the exponential fits. The data include samples from different mice as well as technical repeats of the ELISA measurements (3–4 at each timepoint). Data behind graphs are available as Source Data.
