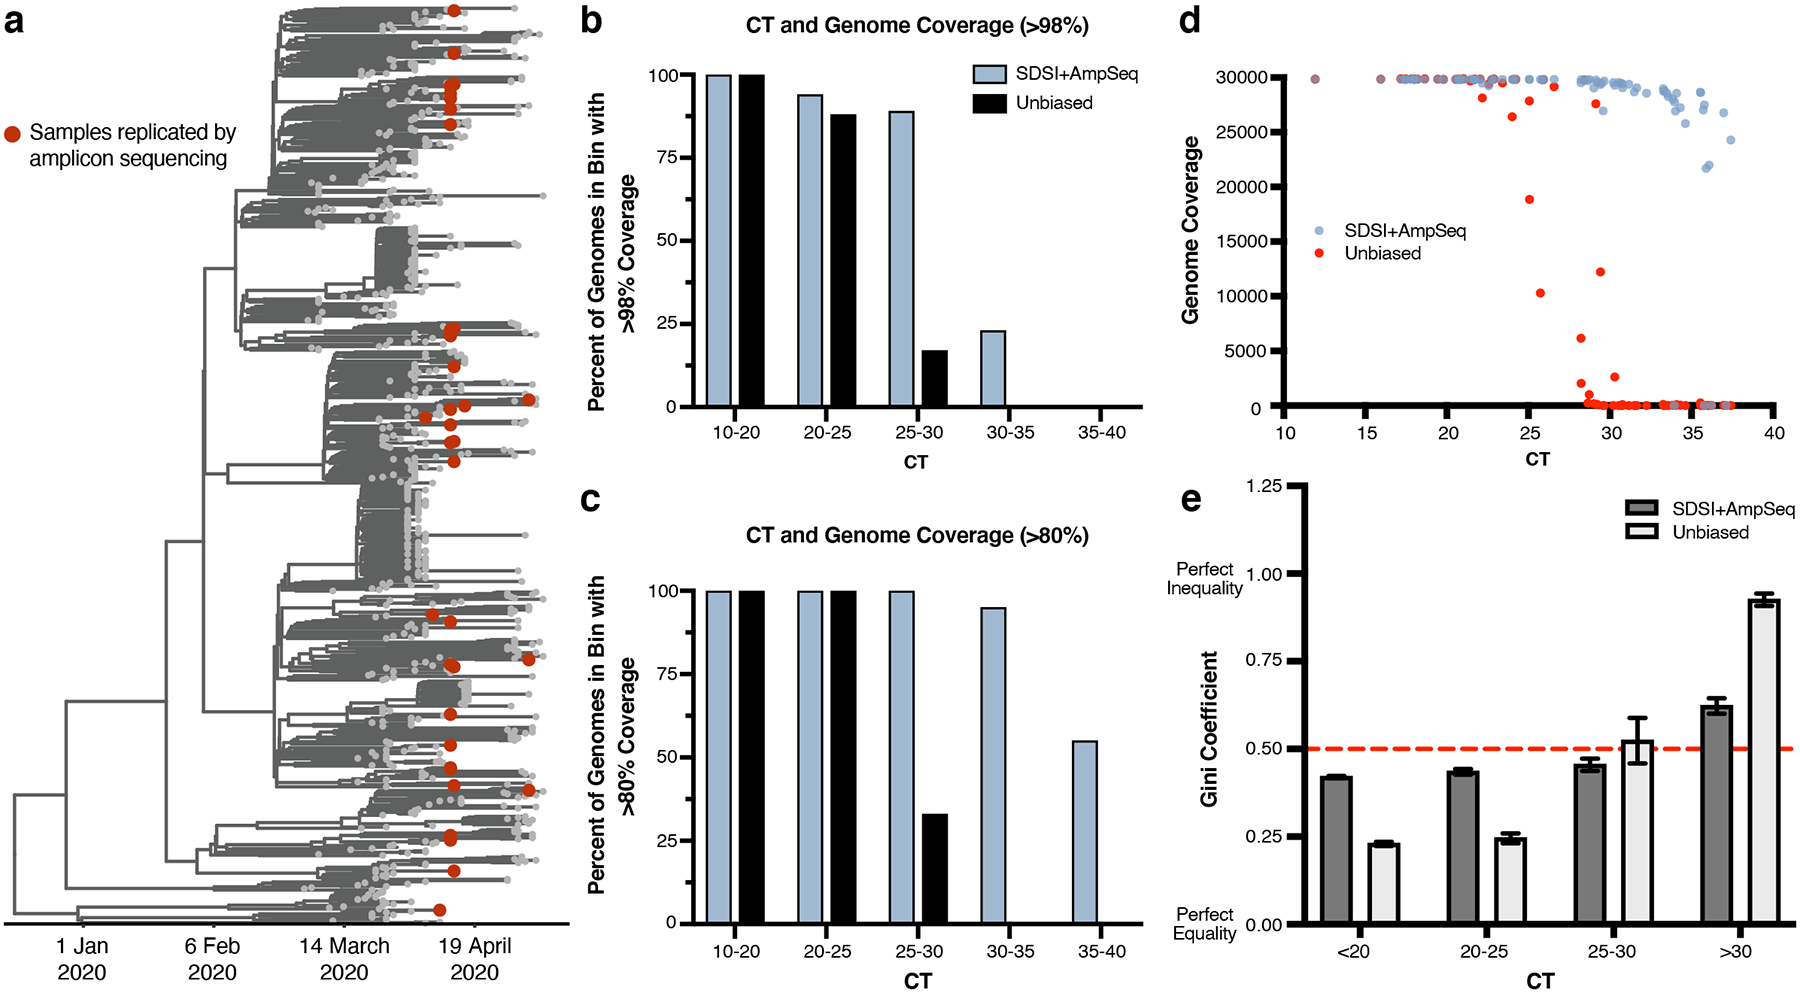
Extended Data Fig. 5. SDSI+AmpSeq over a diverse set of samples has superior genome recovery and more coverage uniformity at higher CTs.

a, Time-measured maximum clade credibility tree of 772 genomes from Massachusetts, reported in Lemieux et al., 2021. The 89 samples compared for metagenomic and amplicon sequencing are shown with red dots. b, Percent of assemblies with greater than 98% or c, 80% coverage in different CT bins (n=81 biologically independent samples, excluded samples had no detectable CT) (downsampled to 975,000 reads). d, Genome coverage for unbiased metagenomic sequencing versus SDSI+AmpSeq amplicon sequencing pipeline (n=81 biologically independent samples, excluded samples had no detectable CT). All samples downsampled to 975,000 reads. e, Gini coefficients grouped by CT (n=70 biologically independent samples, excluded samples that did not generate assemblies in either one or both methods). Dashed red line represents a Gini coefficient of 0.50. Data are presented as mean values +/− SEM.
