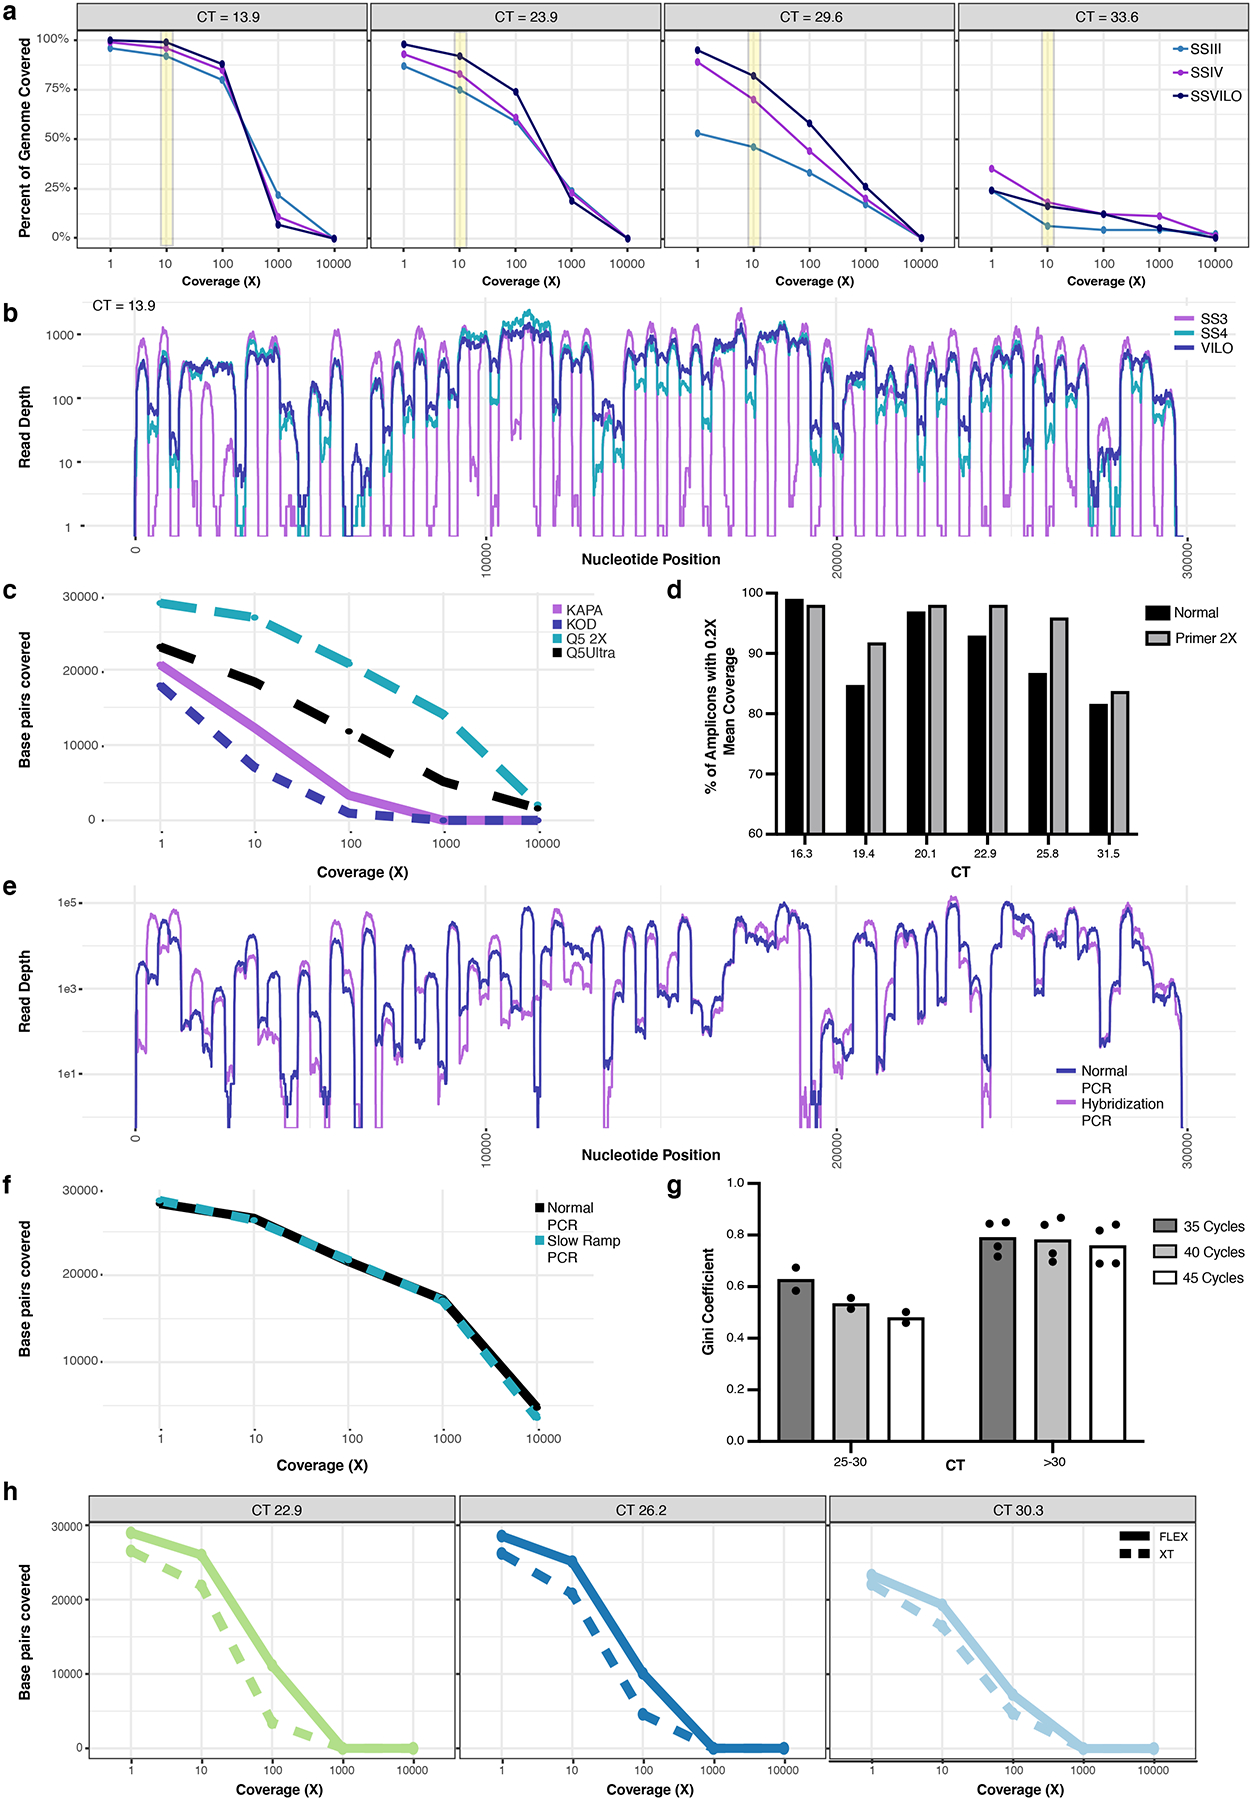
Extended Data Fig. 6. Maximizing Genome Recovery and Coverage with SDSI+AmpSeq.

a, The percent of the target genome covered at various depths of coverage for four individual samples (CT=13.9, 23.9, 29.6, 33.6), with each undergoing cDNA with three different reverse transcriptases (SSIII, SSIV, or SSVILO). Yellow bar highlights comparison between the reverse transcriptases at a coverage depth of 10X. b, Read depth across each nucleotide position for the same sample (CT=13.9) when using these reverse transcriptases. c, Base pairs of the SARS-CoV-2 genome covered at various depths when using different enzymes for the ARTIC PCR (n=1). d, Amplicons with at least 0.2X of the mean amplicon coverage with the normal ARTIC v3 primer pools or with a modified primer pool with a 2X concentration of 20 poor-performing ARTIC primer pairs. Six individual samples with different CTs were used. e, Read depth across each nucleotide position for normal ARTIC PCR vs an alternate hybridization PCR (n=1). f, Base pairs of the SARS-CoV-2 genome covered at various depths when using either normal ramping (3°C/s) or reduced ramping (1.5°C/s) speed for the ARTIC PCR (n=1). g, Mean Gini coefficients for two mid-high CT samples (n=2 biologically independent samples over 3 independent experiments) and four high CT samples (n=4 biologically independent samples over 3 independent experiments) when using either 35, 40, or 45 cycles for the ARTIC PCR. h, Comparison of Nextera DNA Flex and Nextera XT on the number of SARS-CoV-2 base pairs covered at various depths of coverage for three samples with different CTs.
