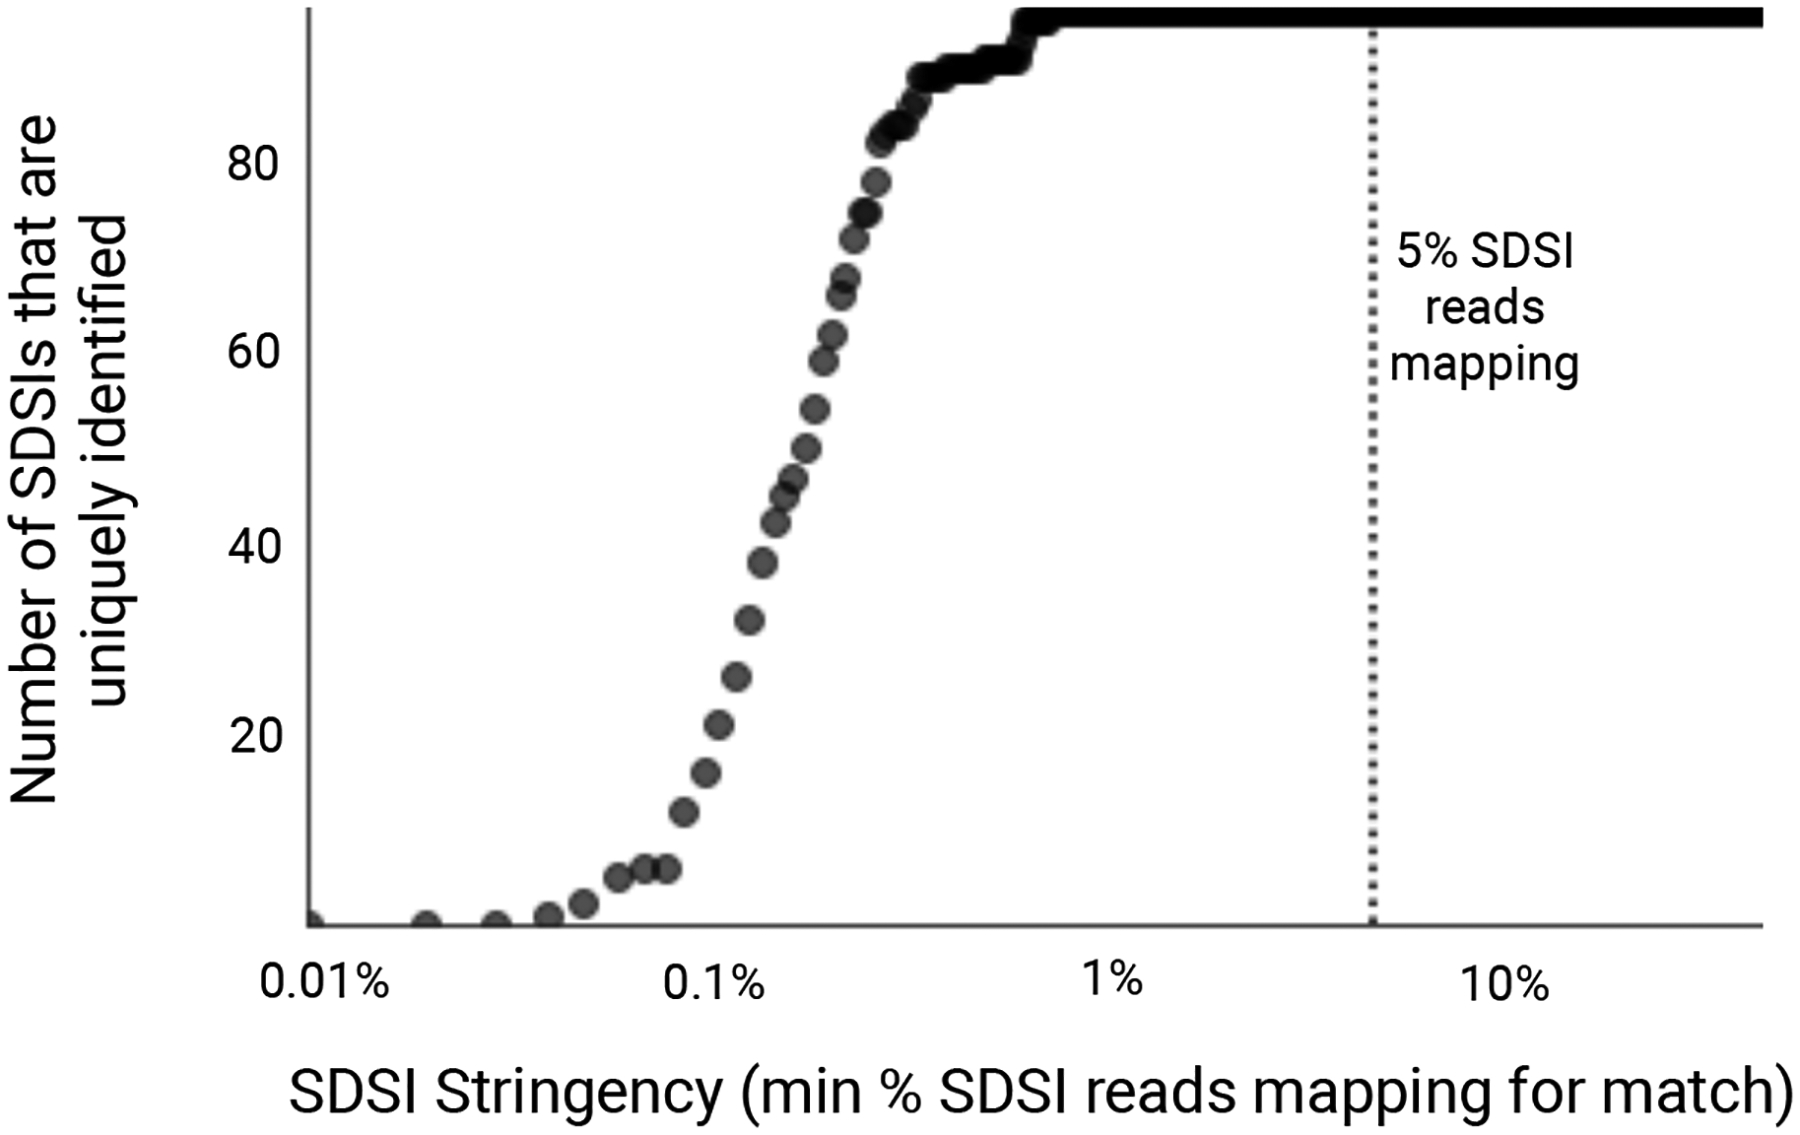
Extended Data Fig. 8. Unique identification of SDSIs given varying thresholds of SDSI mapping stringency.

We considered a range of cutoffs of the percentage of all SDSI-mapped reads mapping to a given SDSI (0.01%-50%, with a step size of 0.01). For an experiment where we sequenced SDSIs without any clinical sample, we calculated, at each cutoff, the number of SDSIs (y-axis) in the set we present (96 total) for which only the expected SDSI had a proportion of mapped reads that exceeded the cutoff (x-axis). Assuming no contamination, all 96 SDSIs should be identified uniquely, i.e. no other SDSI should have a proportion of mapped reads that exceeds the cutoff. The dotted line at x=5% represents the stringency cutoff that we recommend in practice to detect contamination events.
