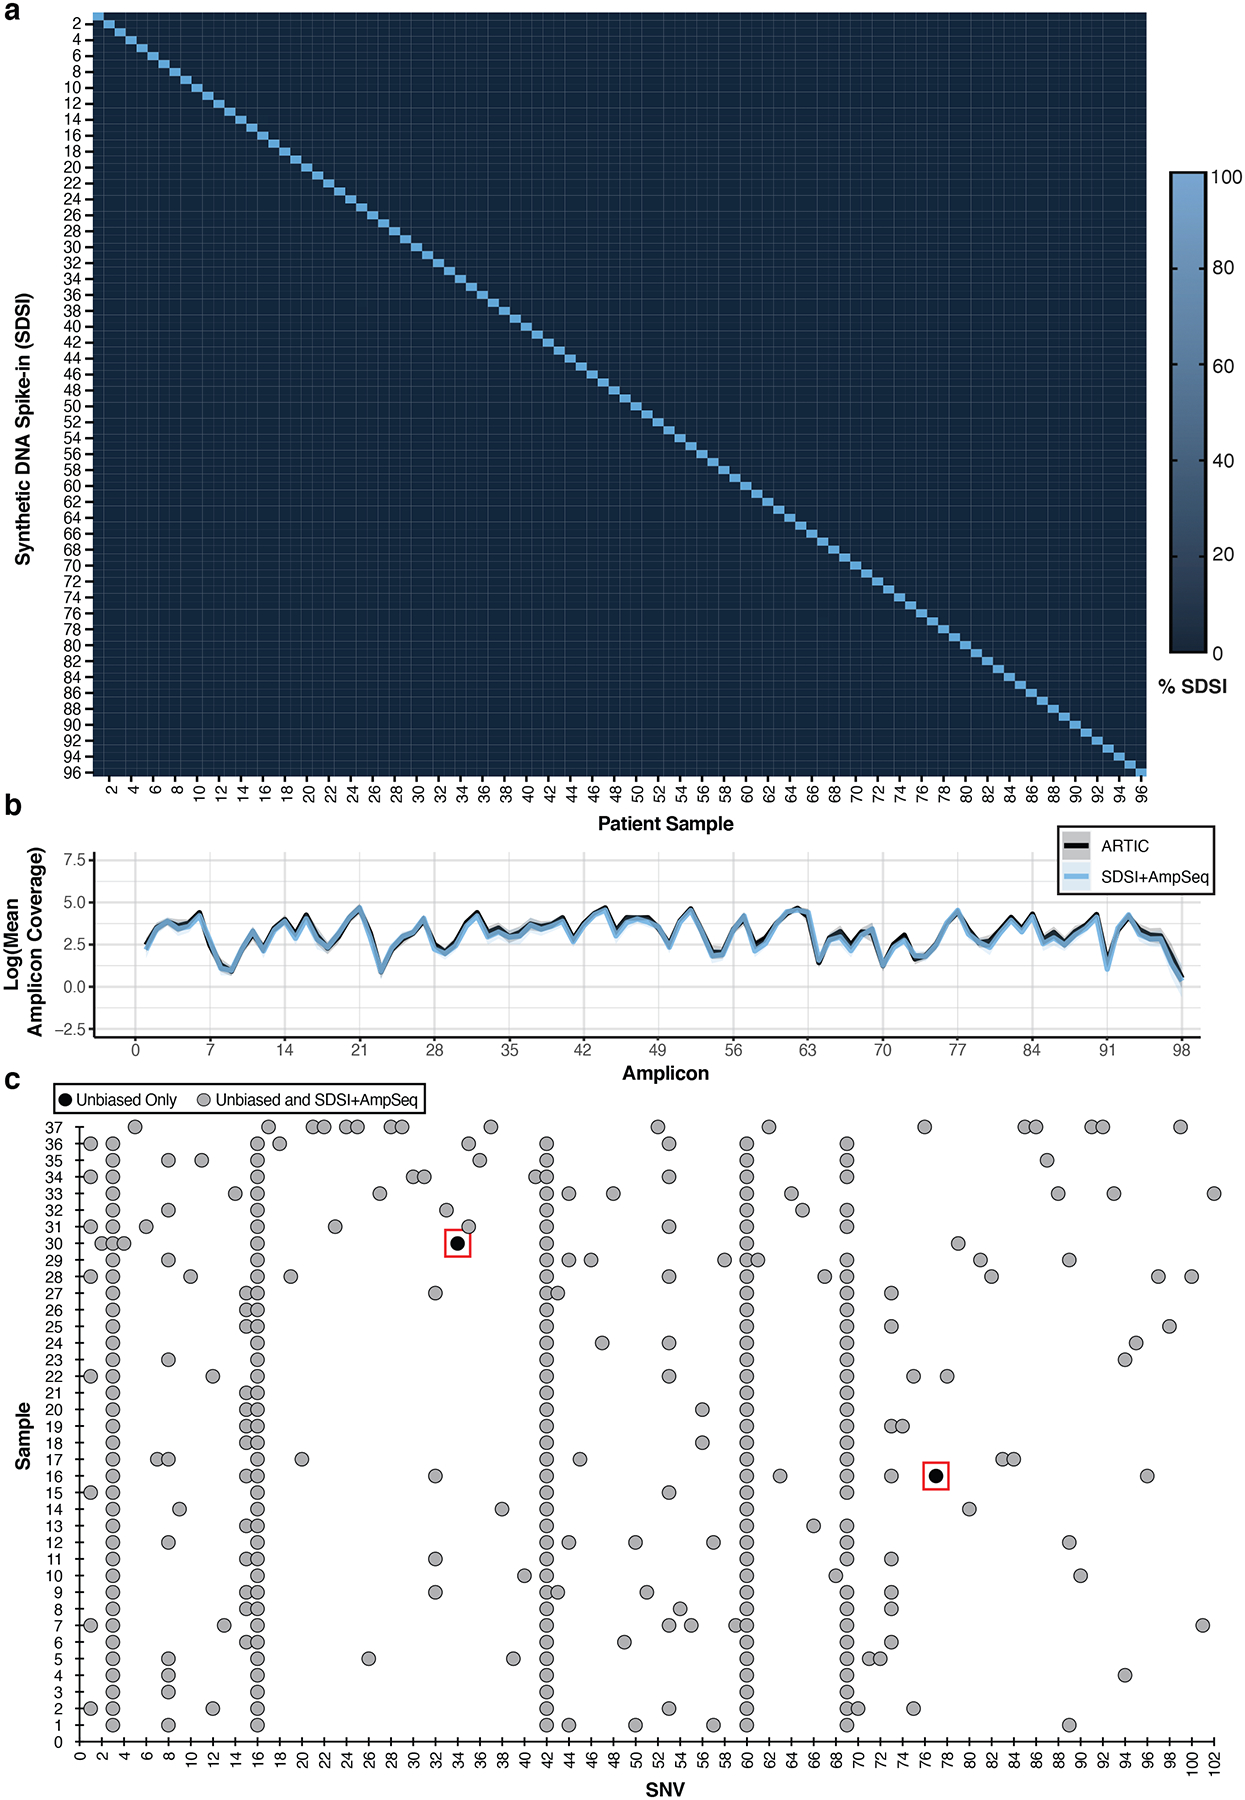
Figure 3. SDSI+AmpSeq amplicon coverage and genome concordance.

a, Percent of SDSI for SDSI 1–96 in patient samples. b, Log of the mean amplicon coverage for the same clinical samples run with and without an SDSI (n=14). A unique SDSI was used in each sample. The solid blue line represents SDSI+AmpSeq and the solid black line is ARTIC only with no SDSI. Blue and black shading around the solid lines represents the 95% confidence interval. There were no statistical differences (p-value > 0.05) in the mean amplicon coverage for each amplicon between the groups (two-tailed Mann Whitney t-test and multiple comparison two-stage step-up Benjamini, Krieger, and Yekutieli test with FDR set to 5%). c, SNV concordance plot between SDSI+AmpSeq and unbiased consensus sequences. Two discordant SNVs, outlined in a red box, were found. Blue dots represent SNVs found in both the unbiased and SDSI+AmpSeq method, whereas black dots indicate the SNV was only present in unbiased.
