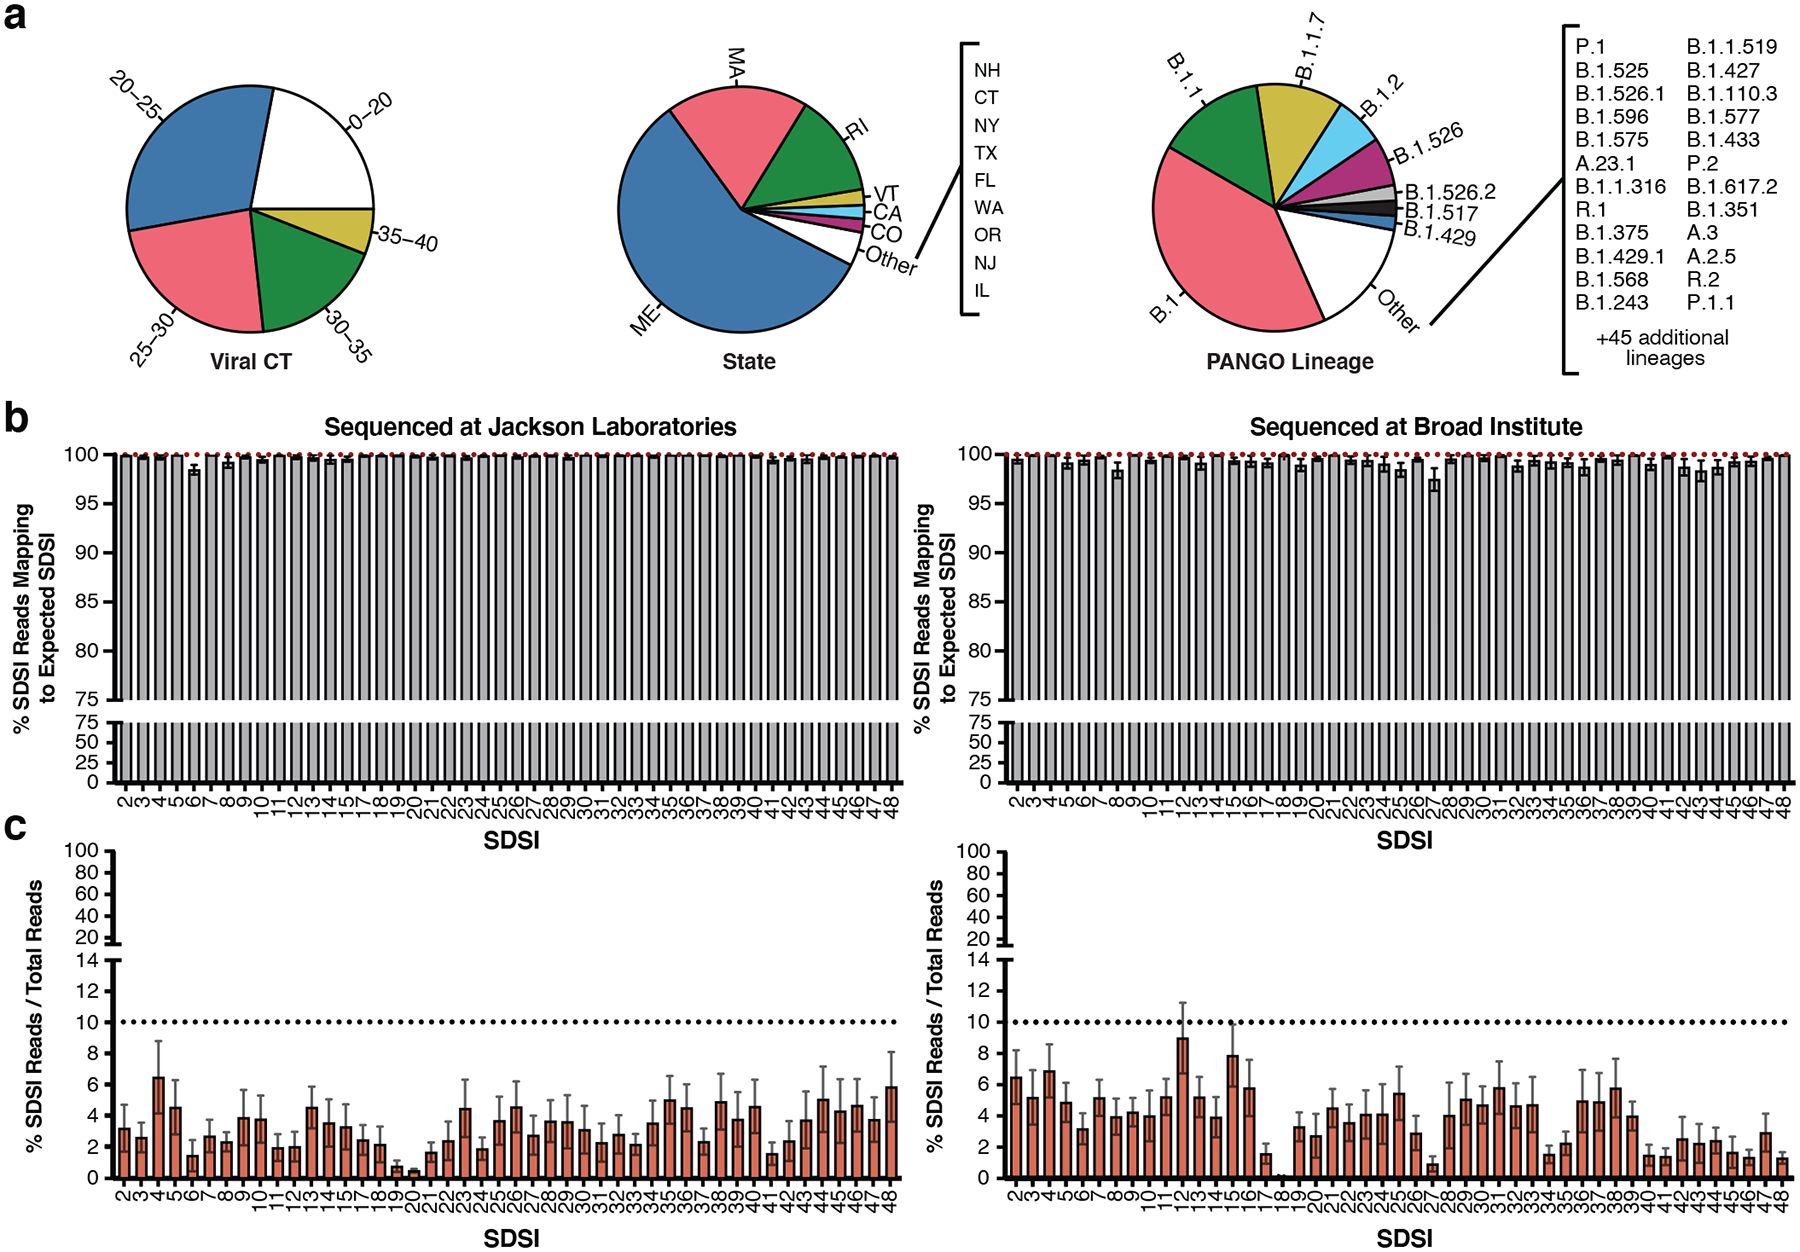
Figure 4. SDSI+AmpSeq performs well across thousands of samples.

a, Sample diversity from two different institutions representing a range of CTs, viral lineages, and states of sample collection from samples where the data was available. b, The percent of SDSI reads out of the sum of all SDSI reads that map to the correct spike-in (Left: JAX, n=3,773 biologically independent samples, Right: Broad, n=2,903 biologically independent samples). Data are presented as mean values +/− SEM. Individual data points are displayed when n ≤ 10. c, The percent of SDSI reads over the total of all sequenced reads for all SARS-CoV-2 positive samples (Left: JAX, n=3,045 biologically independent samples, Right: Broad, n=2,670 biologically independent samples). Data are presented as mean values +/− SEM. Individual data points are displayed when n ≤ 10.
