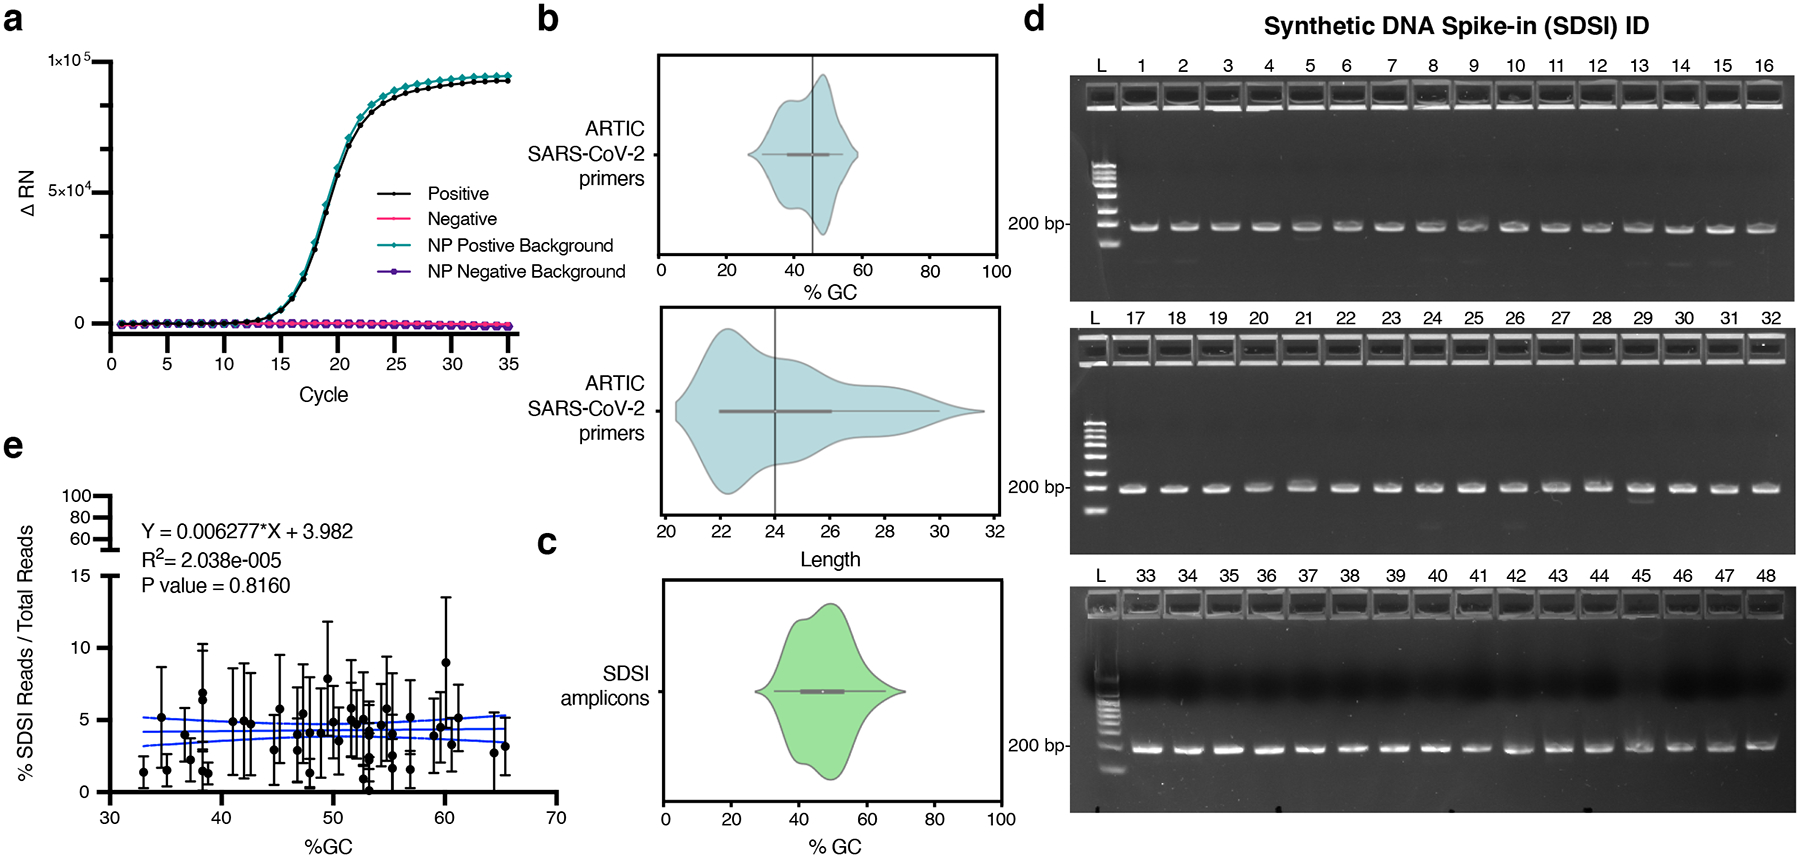
Extended Data Fig. 2. Spike-in validation.

a, RT-PCR for an SDSI in water and a SARS-CoV-2 positive clinical sample background. Mastermix and SDSI specific primers were added to all samples. SARS-CoV-2 positive clinical sample is cDNA generated from a nasopharyngeal (NP) swab. b, The distribution of GC content and length for ARTIC v3 primers. c, The distribution of GC content of SDSI amplicons (n=96). d, 100fmol DNA spike-in amplified under standard ARTIC PCR conditions for 40 cycles run on 2.2% agarose gel image with 188bp amplified spike-in (SDSI 1–48) (n=2, representative image shown). e, % SDSI reads over total reads for SDSI (2–48) over a range of SDSI GC% (33%–65.4%) showed no significant read depth bias. Data are presented as mean values +/− 95% CI. Linear regression: p-value=0.8160, R2=2.038e-005 (Broad, n=2,903 biologically independent samples).
