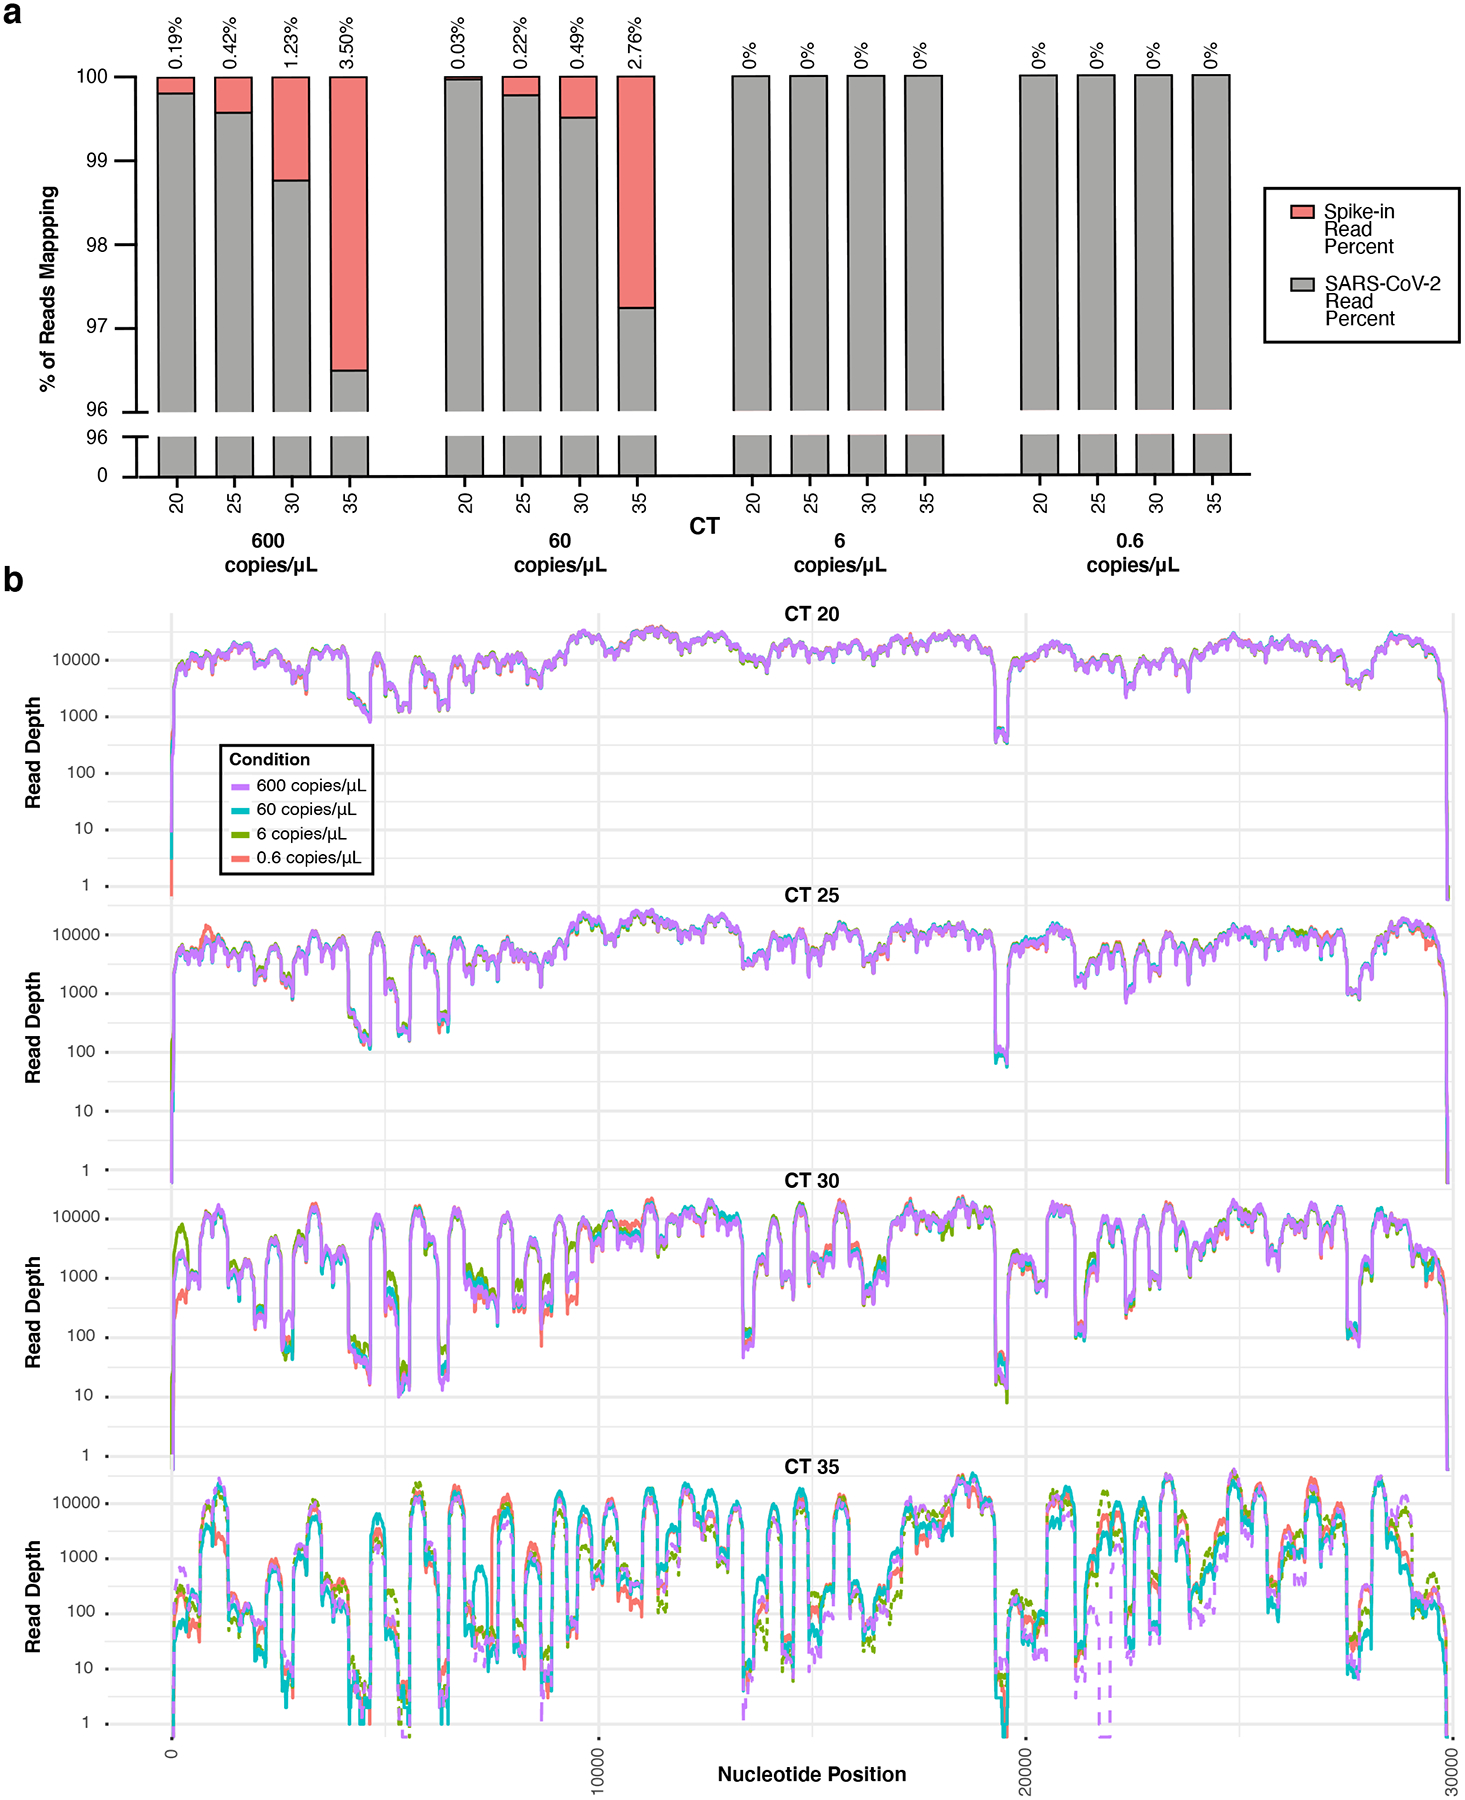
Extended Data Fig. 3. SDSI Titration.

a, In a titration of SDSI 49 across one clinical sample (CT=16) mock diluted to various CTs (CT=20,25,30,35), the number of reads mapping to both SARS-CoV-2 and the SDSI were quantified, and the percentage of each was calculated. SDSI 49 was tested at 600,60,6, and 0.6 copies/μL in each mock diluted sample. b, Coverage plots for the SDSI 49 titration experiment.
