
Figure 6.
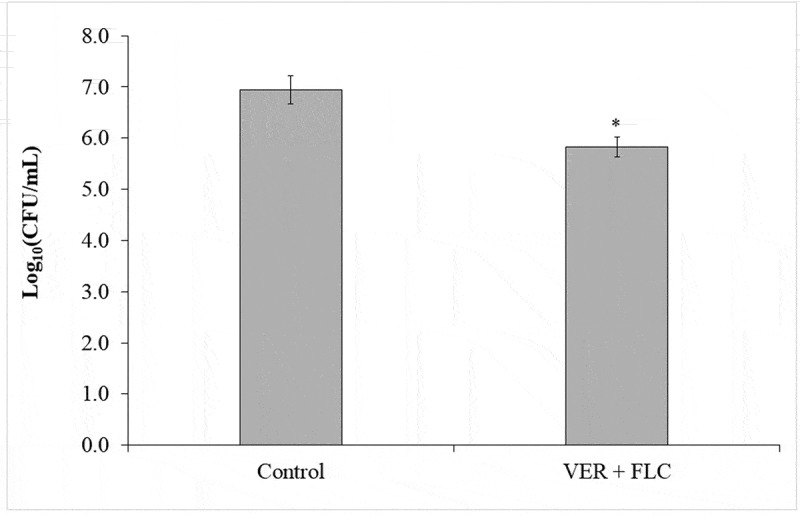
Mean values of log10 (CFU/mL) obtained for biofilms incubated for 24 h with 4 mg/mL VER and 1 μg/mL or 64 μg/mL of FLC for CaS and CaR, respectively. Error bars: standard deviation (n = 3). (*) indicates a significance difference between the treated and control groups (p < 0.05)