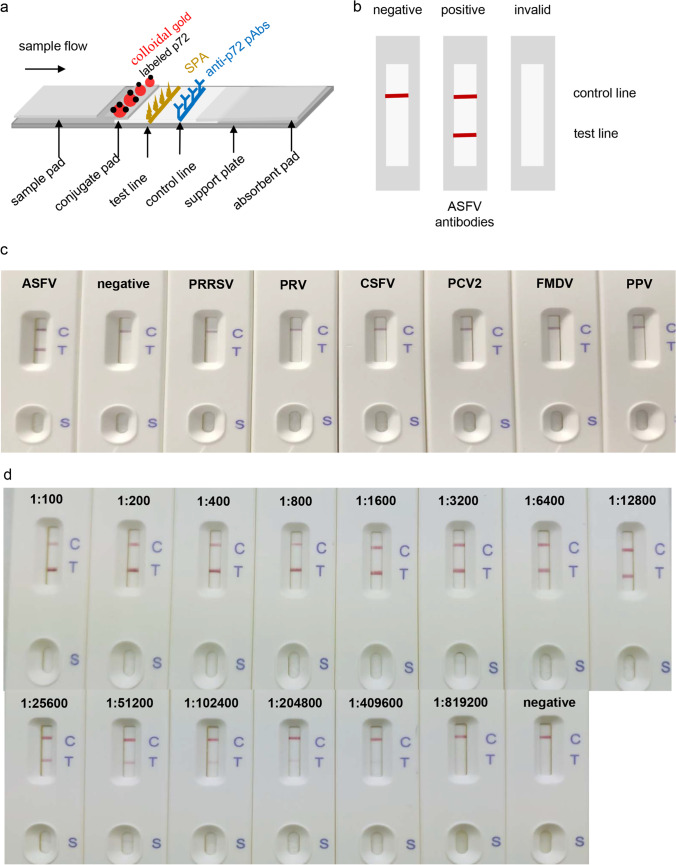
Fig. 3.
Schematic representation and test of the strip. a, b Schematic figures of the strip and the test results. c Cross-reactivity test of the strip. The test serum samples were diluted by 1:200 and added to the sample well of the strip. d The detection limit test of the strip. ASFV-positive standard serum was diluted by two-fold serial dilutions from 1:100 to 1:819,200 and added to the sample well of the strip. After 10 min, the results were observed by the naked eye

