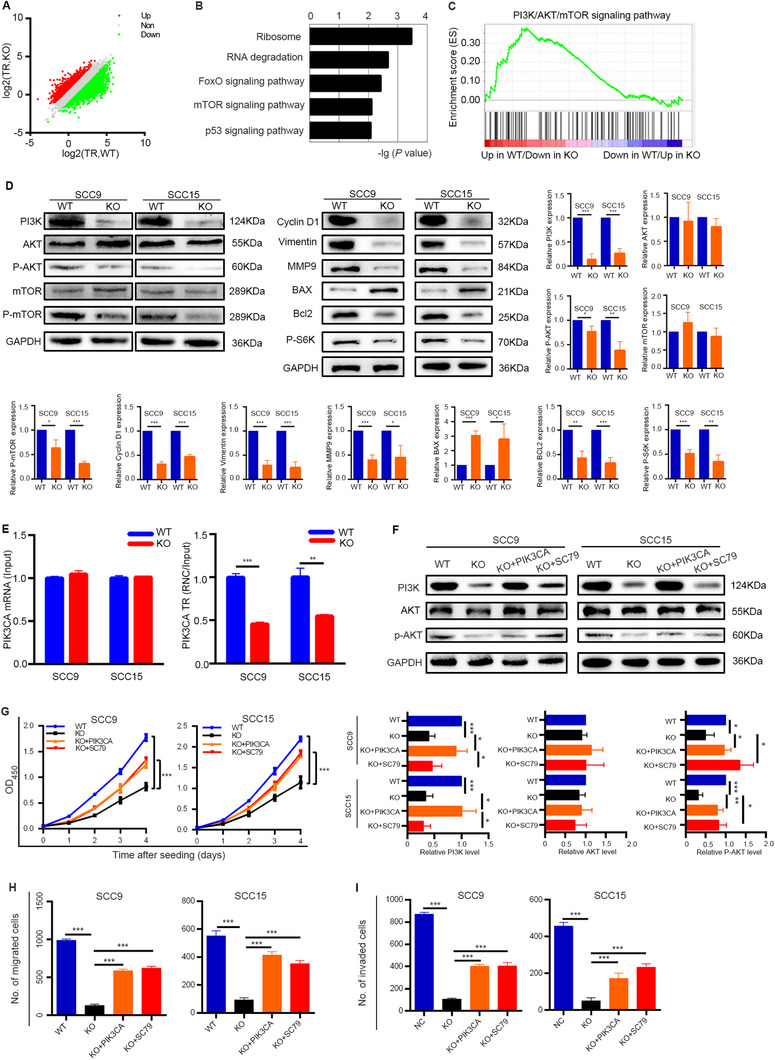
FIGURE 4.

METTL1‐mediated m7G tRNA modification regulates the activity of the PI3K/AKT/mTOR signaling pathway. (A) Scatterplot of the TRs in METTL1‐WT and METTL1‐KO SCC15 cells. TRs were calculated by dividing the ribosome‐binding transcript signals by input RNA‐seq signals. (B) KEGG pathway analysis of the genes with decreased TRs upon METTL1 knockout. (C) The PI3K/AKT/mTOR signaling pathway was enriched in RNC‐seq datasets by GSEA (NES = 1.64, FDR = 0.165, P < 0.001). (D) Western blotting of PI3K/AKT/mTOR signaling pathway proteins and downstream proteins using the indicated antibodies. (E) qRT‐PCR analysis of PIK3CA with RNC and input samples in SCC9 and SCC15 cells. (F) The protein levels of PI3K, AKT, and p‐AKT in METTL1‐WT, METTL1‐KO, PI3K‐transfected METTL1‐KO cells (KO + PIK3CA) and 5 μg/mL SC79‐treated METTL1‐KO cells cultured with (KO + SC79). (G‐I) The proliferation (G), migration (H) and invasion abilities (I) were partially restored after transfecting METTL1‐KO cells with the PI3K plasmid or activating AKT. Data are presented as the mean ± SD and analyzed by Student's t‐test. *, P < 0.05, **, P < 0.01, ***, P < 0.001. Abbreviations: PI3K/AKT/mTOR: phosphatidylinositol‐3‐kinase/protein kinase B/mammalian target of rapamycin; METTL1: Methyltransferase‐like 1; WT: wild‐type; KO: knockout; TRs: translation ratios; KEGG: Koto Encyclopedia of Genes and Genomes; GSEA: gene set enrichment analysis; NES: normalized enrichment score; FDR: false discovery rate; qRT‐PCR: quantitative real‐time PCR; RNC: Ribosome nascent‐chain complex‐bound; MMP9: matrix metalloprotein 9; Bcl‐2: B‐cell lymphoma‐2; P‐S6K: phosphorylation of S6 kinase; BAX: Bcl‐2‐associated X protein; PIK3CA: phosphatidylinositol‐4,5‐bisphosphate 3‐kinase, catalytic subunit alpha; SD: standard deviation
