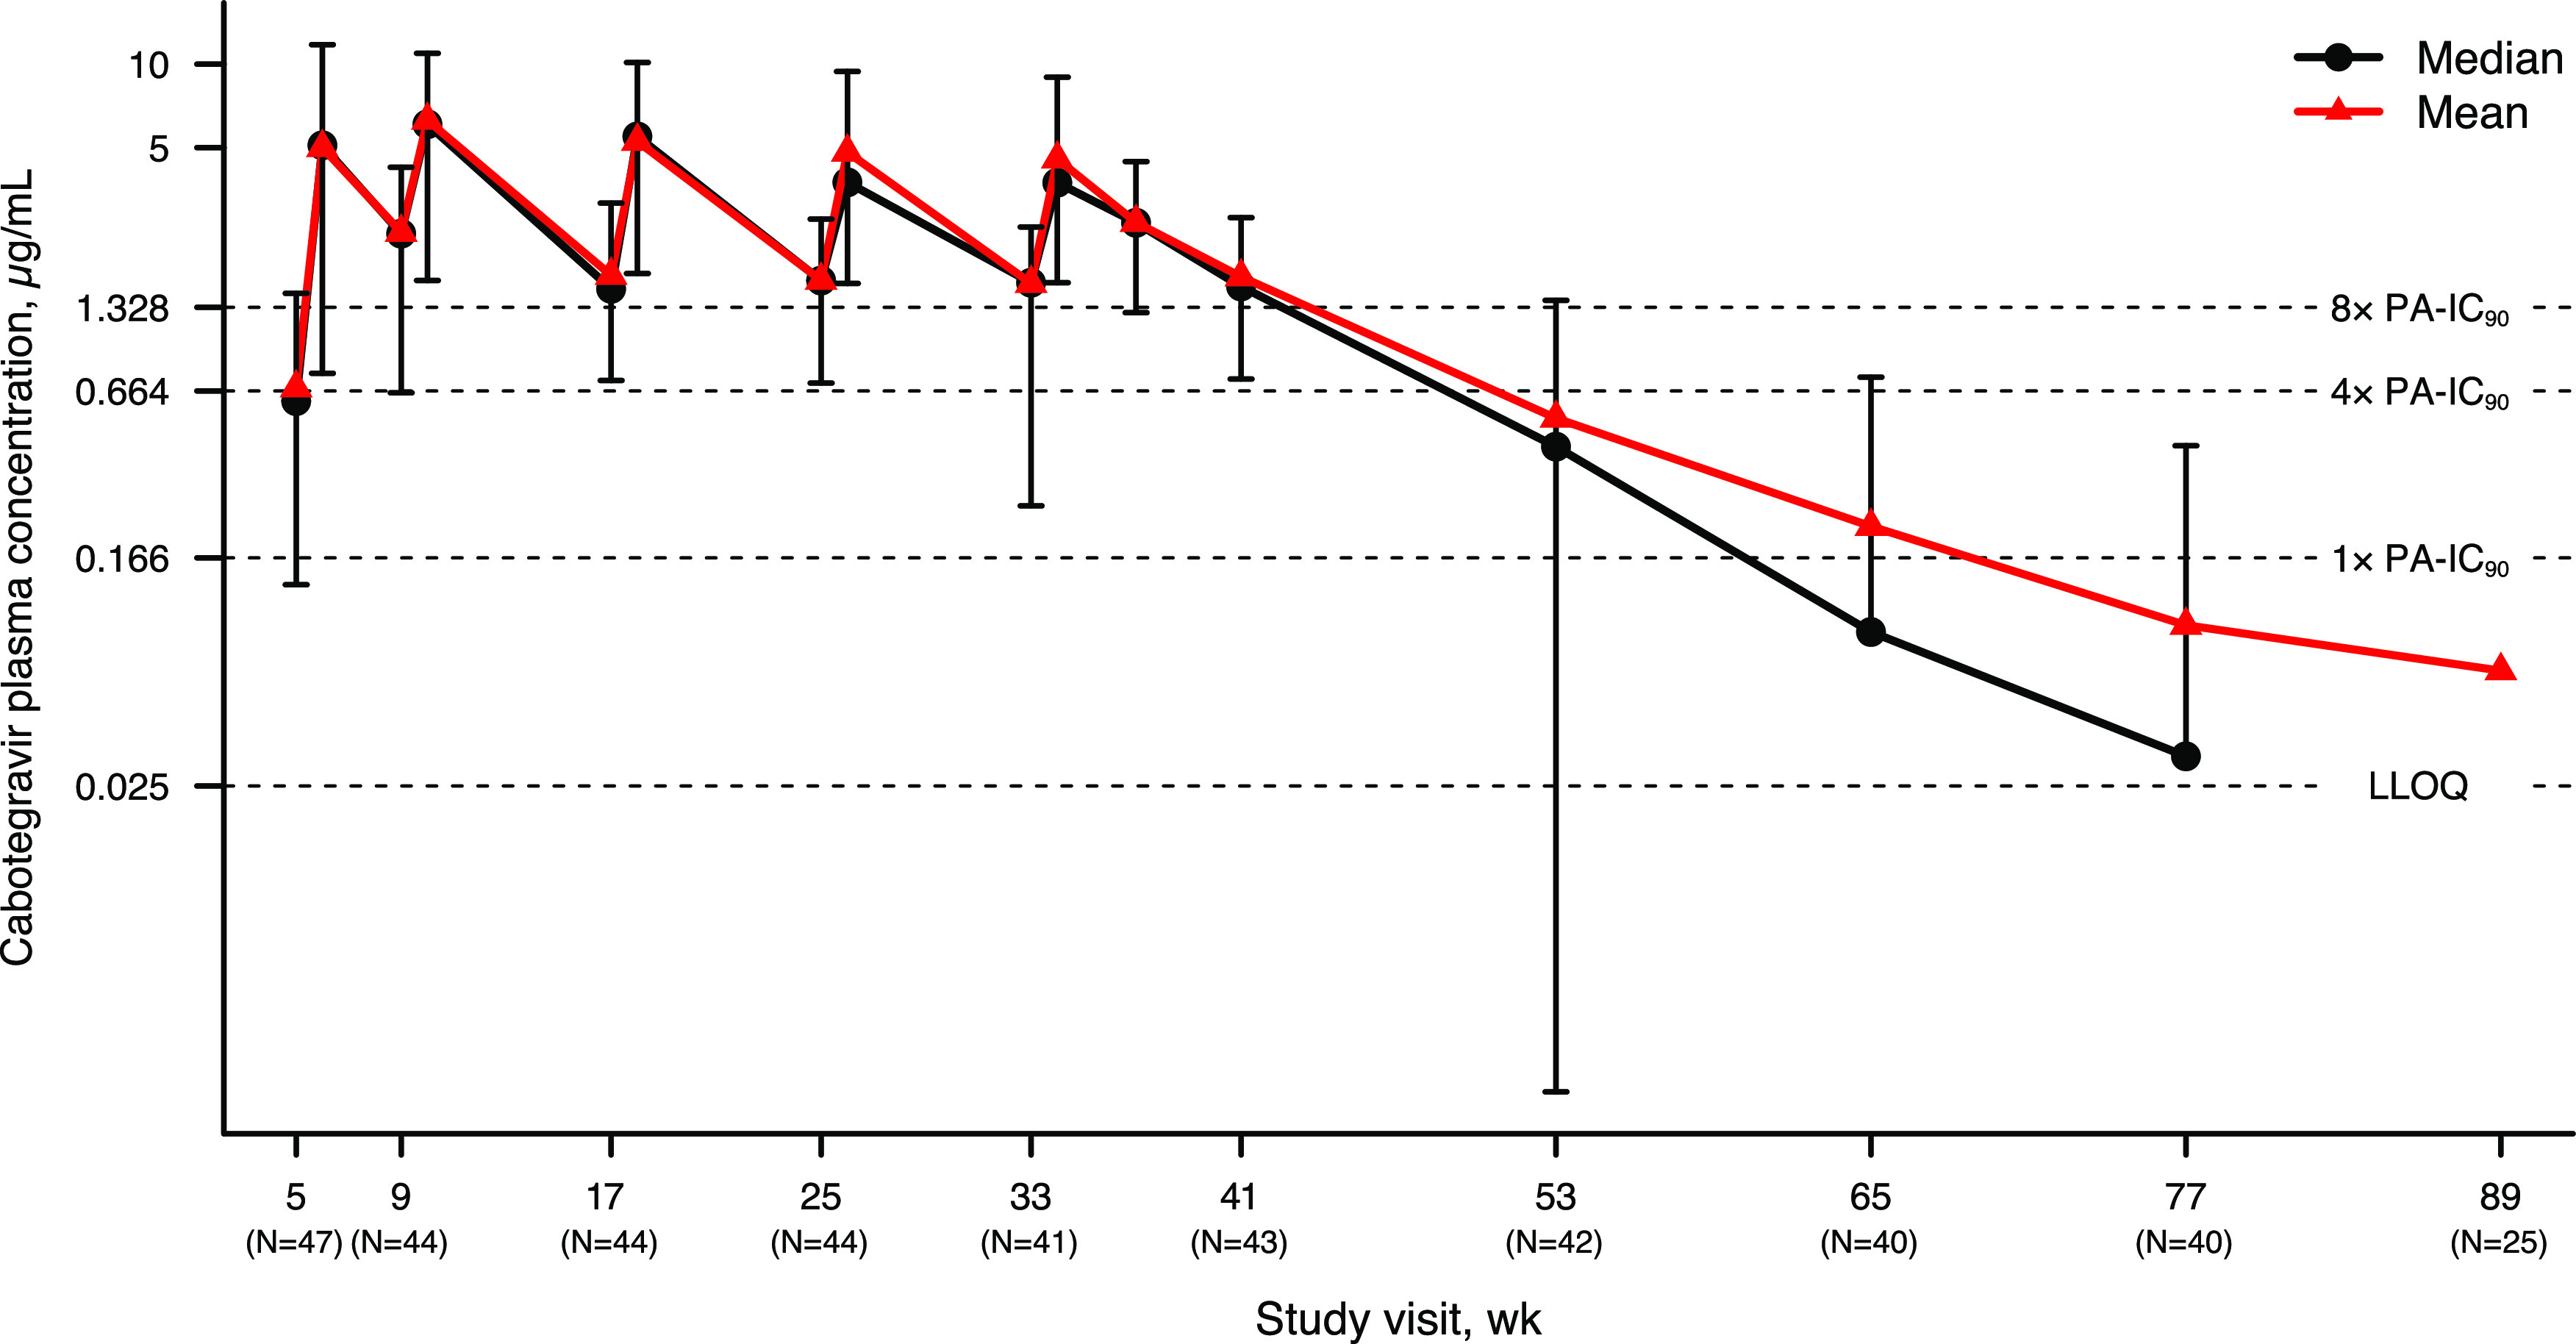
FIG 2.

Cabotegravir plasma concentration-time profile after five cabotegravir LA injections (first injection was at week 5; final injection was at week 33) through week 89. Error bars represent 5th and 95th percentiles. Numbers in parentheses on x axis represent the numbers of participants with cabotegravir concentrations at trough and concentrations in the follow-up phase. Nonquantifiable concentrations were imputed as zero for the purpose of calculating statistics. LLOQ, lower limit of quantitation; PA-IC90, in vitro protein-adjusted concentration resulting in 90% of the maximum inhibition of viral growth for cabotegravir. The week 89 visit was delayed in 12 participants, and therefore, 25/37 participants who completed the week 89 visit were considered within the visit window. Median at week 89 and the 5th percentile beyond week 53 were zero and, therefore, could not be displayed.
