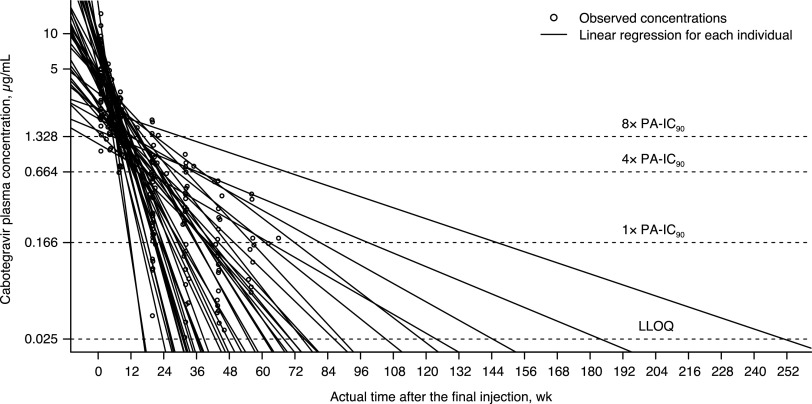
FIG 3.
Individual cabotegravir terminal concentration-time profile with log-linear regression after the final injection. Linear regression was applied to fit the log-transformed cabotegravir plasma concentration data over actual sampling time after the final injection in each participant (solid line) and to calculate the time from the final injection to the time when cabotegravir plasma concentration decreased to LLOQ. PA-IC90 = 0.166 μg/mL. LLOQ, lower limit of quantitation; PA-IC90, in vitro protein-adjusted concentration resulting in 90% of the maximum inhibition of viral growth for cabotegravir. All 44 participants were included in this analysis, regardless of whether the week 89 visit was delayed or not.

