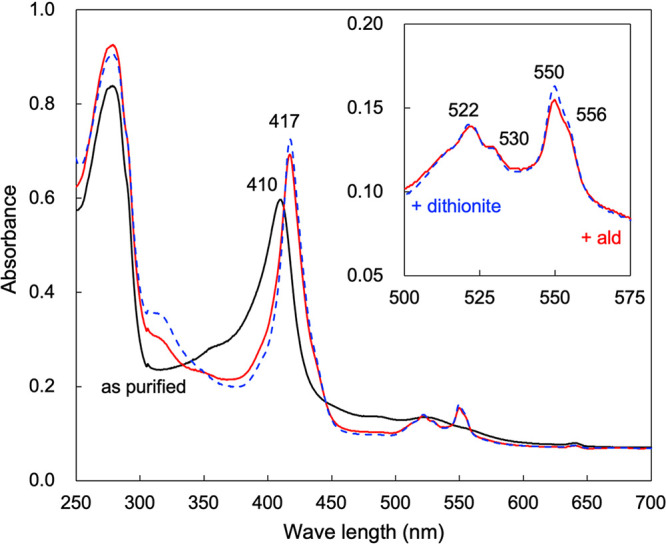
FIG 2.

Absorption spectra of the purified AldFGH complex from G. diazotrophicus strain MR17. Shown are absorption spectra from 250 to 700 nm with an enzyme concentration of 0.7 mg protein mL−1 in 10 mM K+-phosphate buffer (pH 6.0). The solid black line is the absorption spectrum of the “as-purified” AldFGH complex. The AldFGH complex was reduced with 10 mM acetaldehyde (solid red line), and a few grains of sodium dithionite were then added to the protein solution to chemically reduce the AldFGH complex (dashed blue line). The inset shows enlarged absorption spectra of the acetaldehyde-reduced and dithionite-reduced AldFGH complex from 500 to 575 nm.
