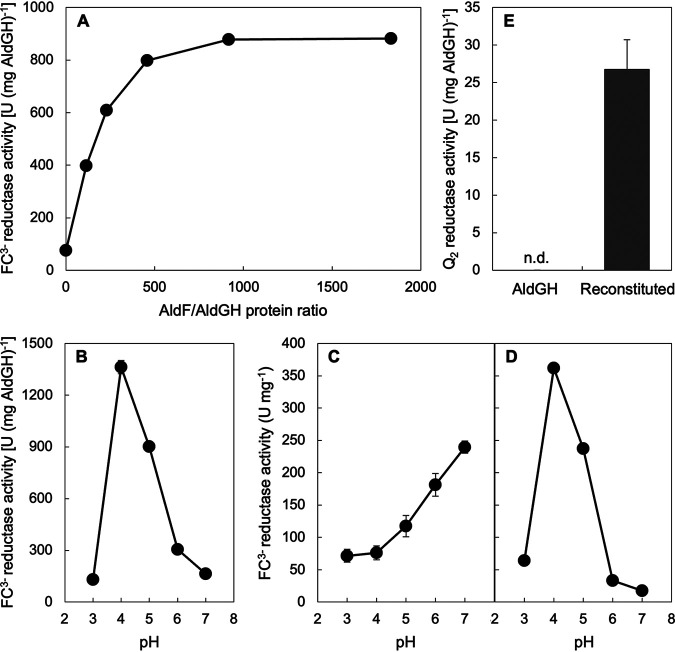
FIG 5.
Dissection of the AldFGH complex and reconstitution of the AldGH subcomplex with AldF. (A) Saturation curve of the ferricyanide (FC3−) reductase activity as a function of a protein ratio in milligrams of partially purified AldF to the purified AldGH subcomplex. The mixture of the AldGH subcomplex and AldF was incubated at 25°C for 10 min to accelerate reconstitution. Next, the acetaldehyde:FC3− oxidoreductase activity of the mixture was assayed at pH 4.0. (B) Specific FC3− reductase activity of the reconstituted AldFGH complex (protein ratio of 920) as a function of pH. (C) Specific FC3− reductase activity of the purified AldFG subcomplex as a function of pH for comparison with the data in panel B. (D) Specific FC3− reductase activity of the purified AldFG subcomplex as a function of pH for comparison with the data in panel B. (E) Q2 reductase activity of the purified AldGH subcomplex (AldGH) and the reconstituted AldFGH complex (protein ratio of 920) (Reconstituted) at pH 4.0. Mean values and standard deviations from triplicate assays are shown as the specific activity to the protein amount of AldGH (A to C and E) or AldFGH (D). n.d., not detected.

