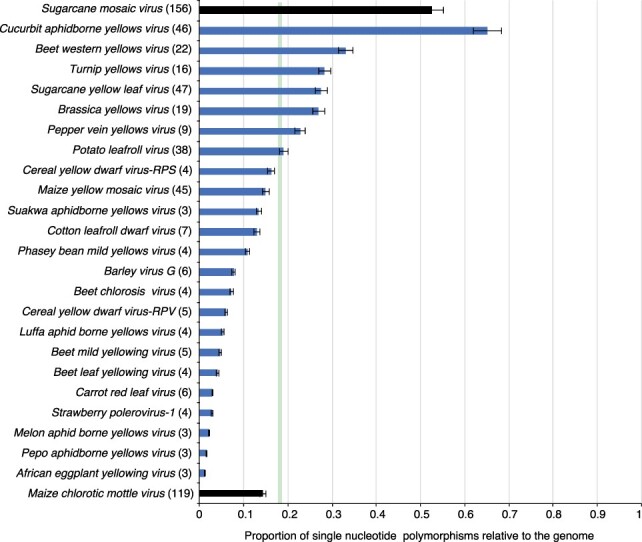
Figure 3.

SNPs in poleroviruses. For each species and for the entire genome, SNPs were estimated in a 50-nt window. Bars represent the average (and standard error) proportion of polymorphic sites (number of SNPs/length of the genome). For each species, the number of nucleotide accessions is indicated in parenthesis. The green vertical line represents the mean and a 99 per cent confidence interval (P-value <0.01). For comparison, SCMV and MCMV were used as hypervariable and genetically stable, respectively.
