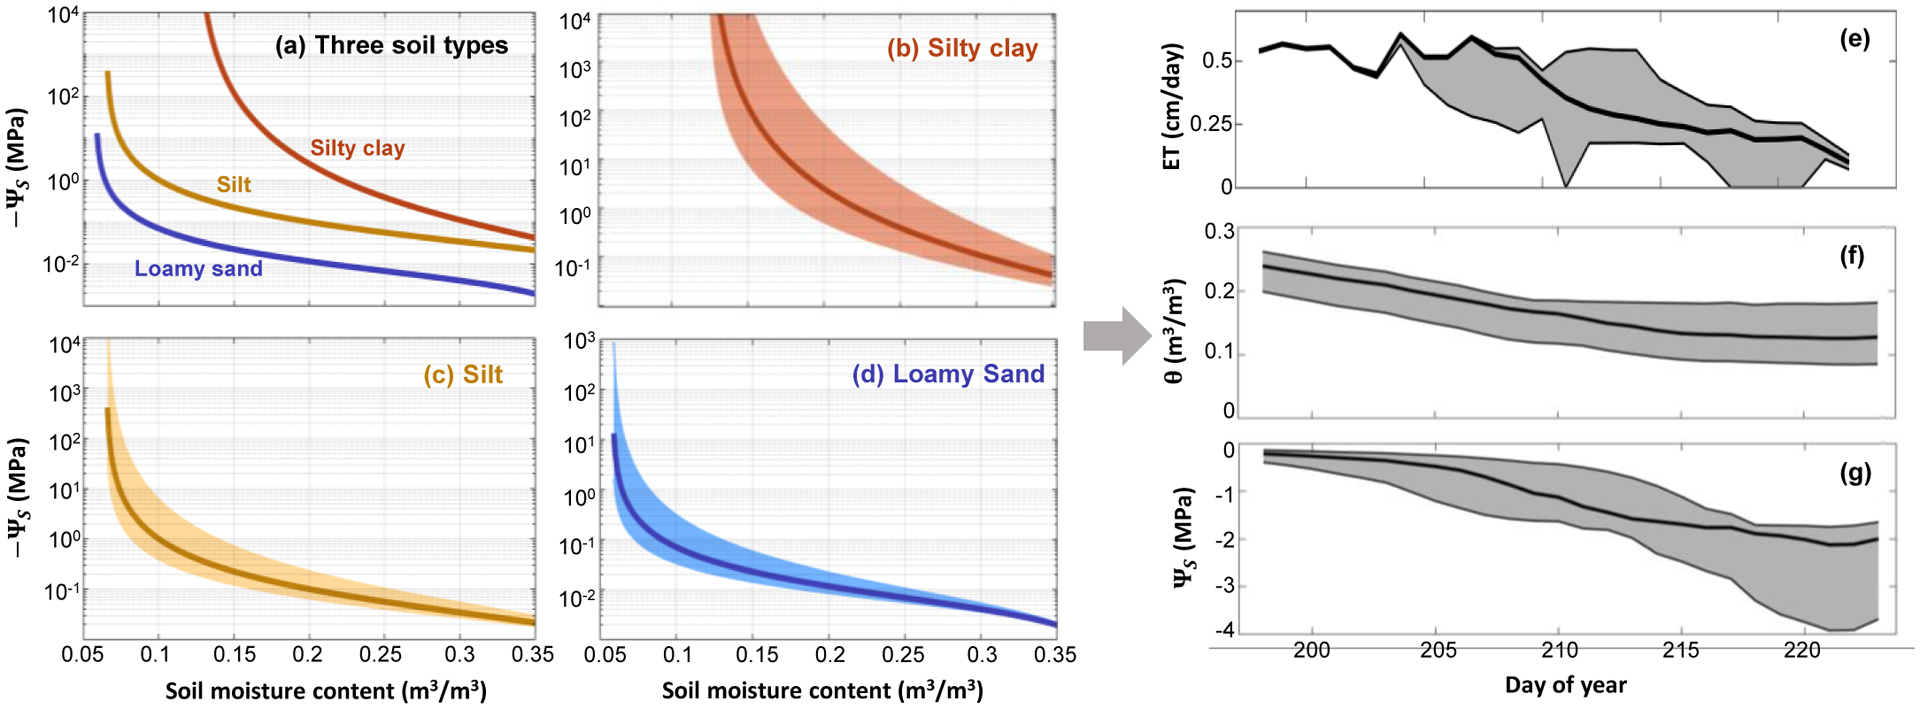
Figure 2: Water retention curve and pedotransfer function (PTF) uncertainty.

Across soil types, ΨS can differ by an order of magnitude for a given soil moisture content (panel a, with curves generated from the van Genutchen model11,, see methods). Panels b-d illustrate the uncertainty in the water retention curve attributable to PTF parameter uncertainty. The shaded area shows the 90% confidence interval due solely to variation in a single parameter of the van Genuchten model (the ‘n’ shape parameter, which is linked to pore size) within just one standard deviation of its reported distribution for each soil class from a popular PTF18. Thick lines in panels b-d are the same as in panel a. The PTF-driven uncertainty in the water retention curve propagates into large uncertainty for modeled fluxes and pools. Specifically, variation in the van Genuchten ‘n’ parameter within again just one standard deviation of its reported range18 causes the 90% confidence intervals on modeled evapotranspiration (ET), soil moisture content (θ, and ΨS (shaded gray areas, panels e-f) to vary by a magnitude comparable to the mean value of each parameter (thick black line). Simulations were run using the HYDRUS 1-D79 model for a forest site in Indiana, US80 during a drought event (see methods for details).
