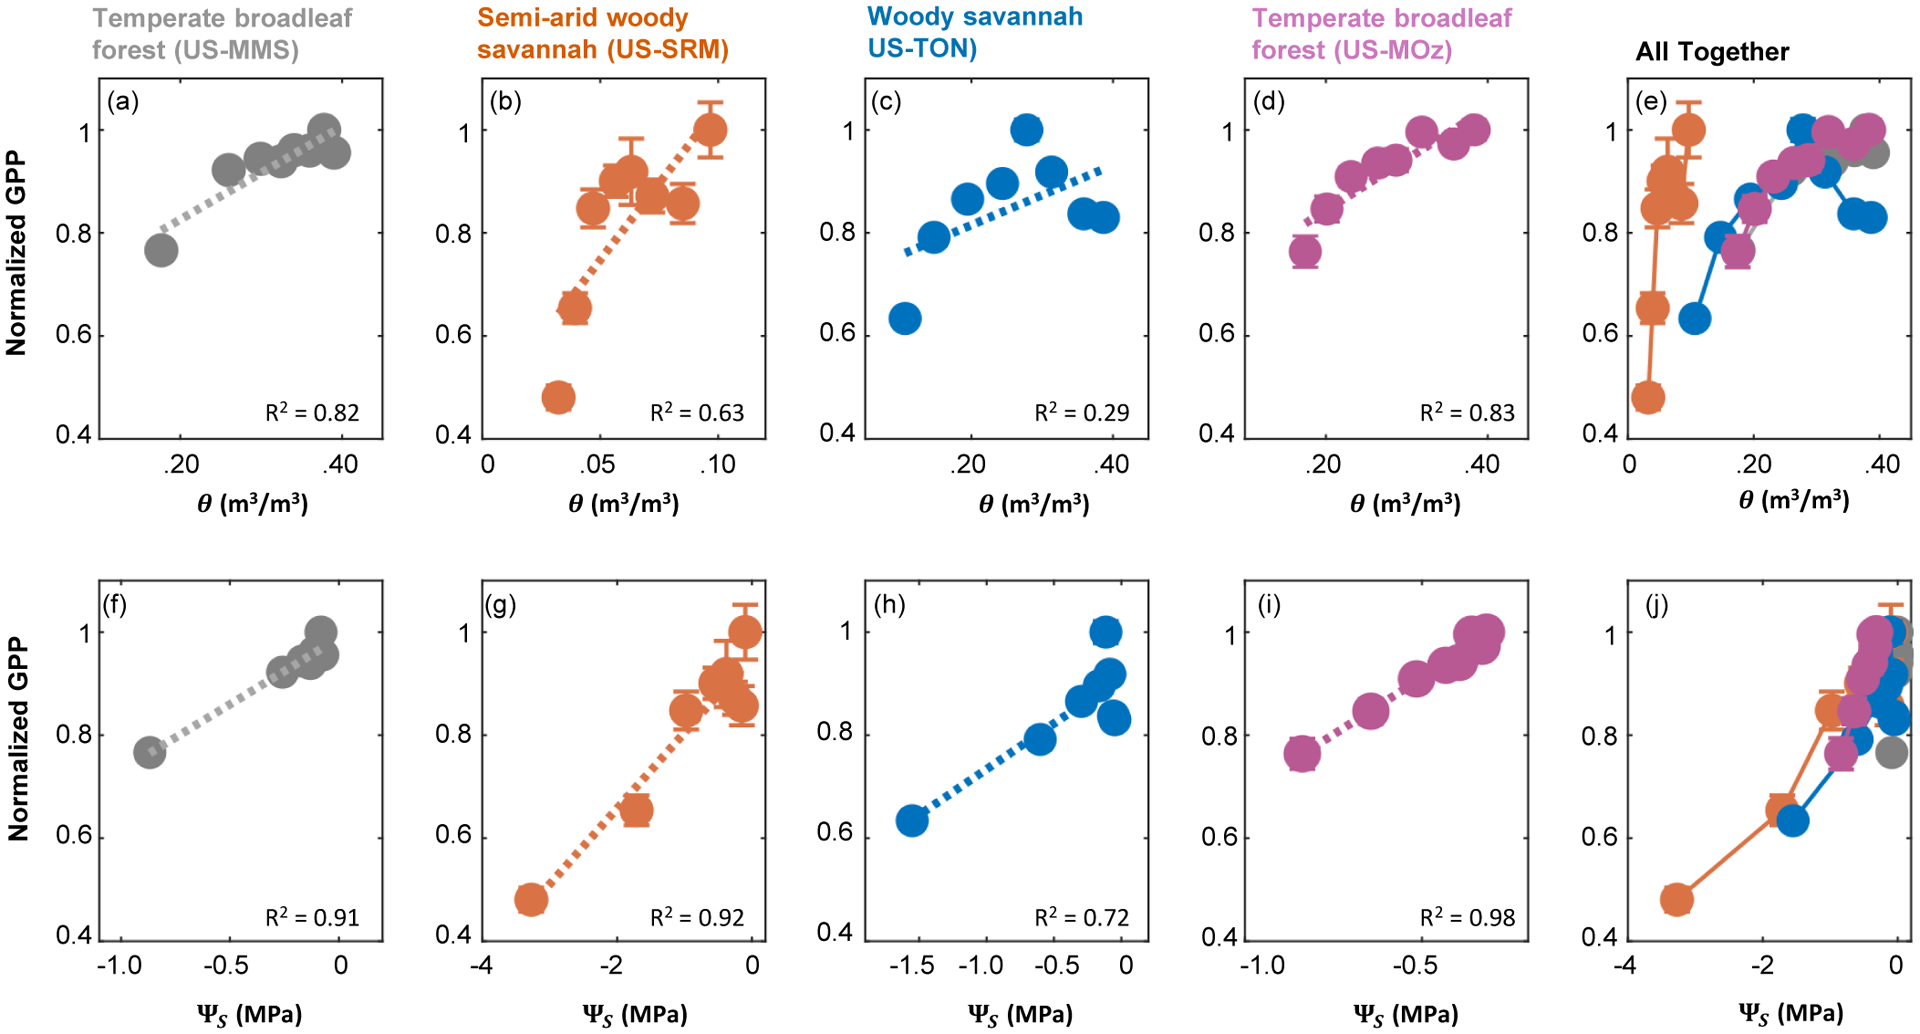
Figure 4: Soil water potential better explains variability in GPP when compared to soil moisture content.

Across four AmeriFlux sites for which site-specific water retention curves were measured38,85–87, the relationship between GPP (normalized by its well-watered rate) and ΨS (bottom row) is more linear than the relationship between GPP and θ (top row). Moreover, cross-site heterogeneity in the response functions is reduced when it is ΨS, as opposed to θ, on the x-axis (compare panel e to panel j). GPP estimates were obtained from AmeriFlux, with site codes given in parentheses. Error bars indicate one standard error of the mean, which is quite small for some of the binned averages. See methods for more details.
