Fig. 3.

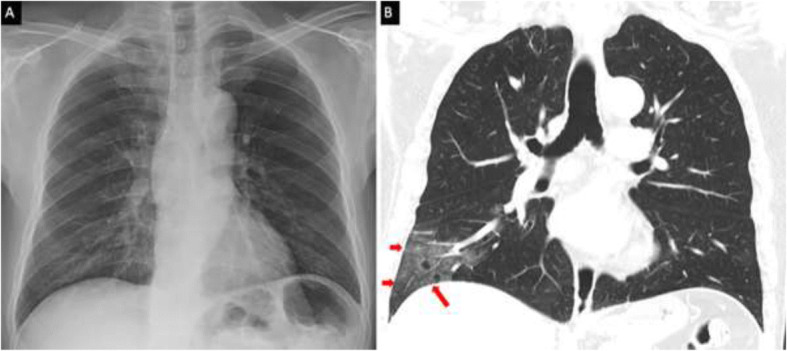
Comparison of Chest X-Ray (image A) and CT thorax coronal image (image B). The GGO in the right lower lobe periphery on the CT (red arrows) [21]

Comparison of Chest X-Ray (image A) and CT thorax coronal image (image B). The GGO in the right lower lobe periphery on the CT (red arrows) [21]