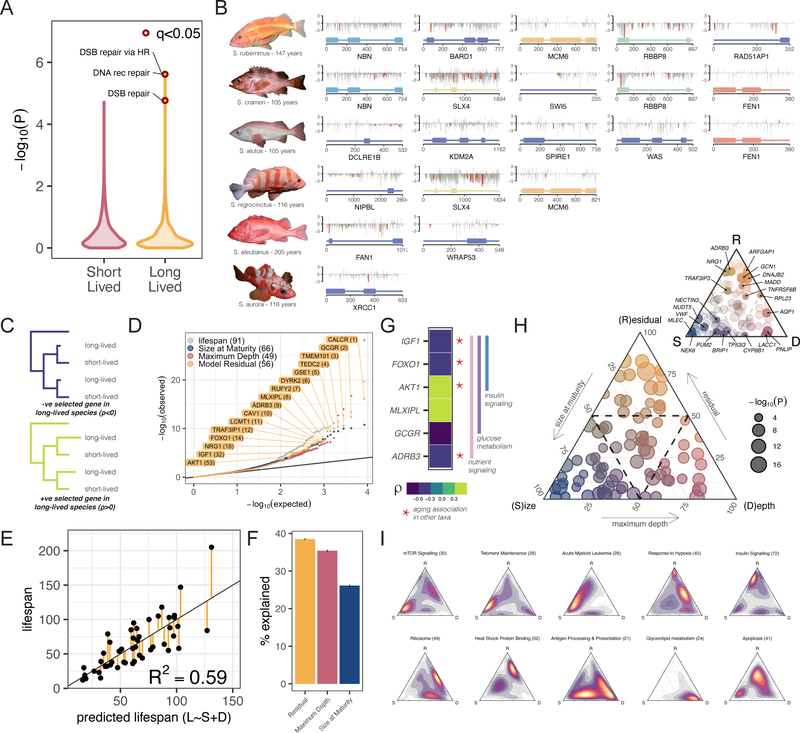
Figure 2 – Genetic underpinnings of lifespan adaptations:
A) Distribution of pathway enrichment P-values for genes under positive selection in short- and long-lived species. B) Schematics of the 16 DNA replication/repair/maintenance genes exhibiting positive selection in long-lived rockfish. Domain structure (bottom), grey lines indicate putative functional consequence of rockfish amino acid compared to human (PROVEAN score). Red and green bars indicate mutations distinct from all non-long-lived taxa colored by SIFT score - Tolerated (green) / Damaging (red). C) Schematic representation of relative evolutionary rate test and D) P-value distribution of genes from relative evolutionary rate test (RERconverge) of correlation between evolutionary rate and individual traits. Lifespan and the individual components of a predictive linear model of lifespan (E) are used as traits. Gene names are highlighted for the top 12 genes associated with the linear model residual as a trait in addition to four other significant gene candidates previously associated with aging (full gene list in Table S14). E) Linear regression model between maximum lifespan and predicted lifespan based on body size and depth for different species. F) Proportion of variation in lifespan explained by size, depth, and the residual from the linear model. G) Relative evolutionary rates of six genes involved in glucose, insulin, and nutrient signaling four of which have been associated with aging in other taxa (Table S14). H) Ternary plot of 91 lifespan associated genes plotted as a function of the relative importance along linear model axes with dotted line at 50% (inset with gene labels) and heatmaps of pathway enrichment along axes (I).

