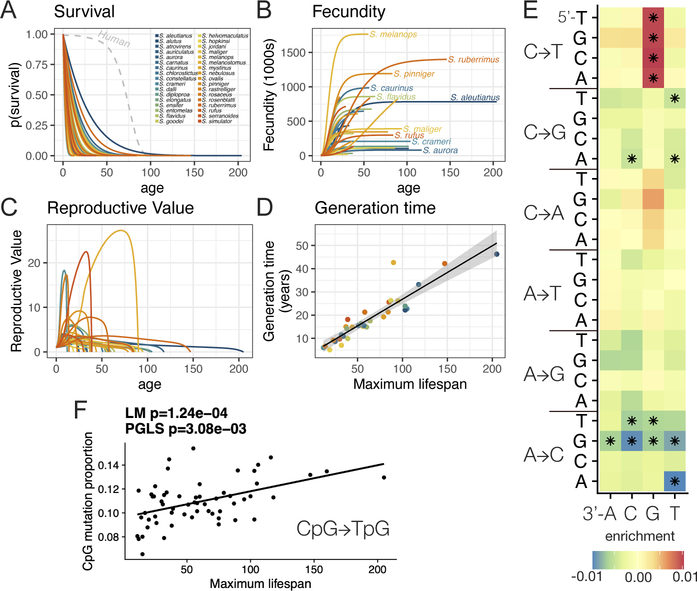
Figure 5 – Shifts in life history traits reshape the mutational spectrum of segregating genetic variation:
A) Survival curves for 34 rockfish species. Humans, shown for comparison, exhibit similar maximum lifespans to many rockfish species but different survival curves (Type I versus Type III survival). B) Rockfish fecundity (births per season) plotted as a function of age. C) Reproductive value plotted as a function of age. D) Generation times estimated from survival and fecundity plotted as a function of lifespan. E) Association of segregating single nucleotide variant mutation types with lifespan across all trinucleotide contexts. Asterisks indicate age-associated mutational profiles significant after multiple testing correction (q<0.05). F) The proportion of segregating CpG->TpG mutations as a function of maximum lifespan.

