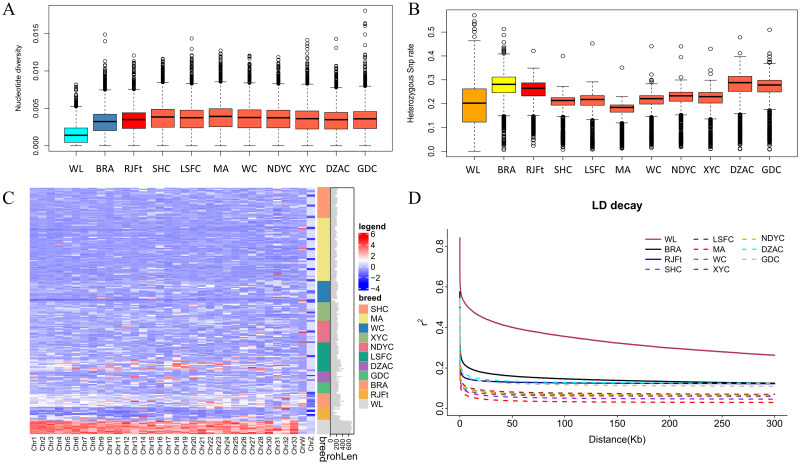
Fig 2. Genome diversity and LD decay of 11 chicken populations.
(A) Genome nucleotide diversity was calculated with a window size of 40 kb and a step size of 20 kb. (B) Genome heterozygosity within 500kb sliding window across the genome. (C) The ROH of each chromosome in different breeds. The redder color represents longer ROH, the bluer the shorter. (D) Linkage disequilibrium (LD) decay, denoted with one line for each population.

