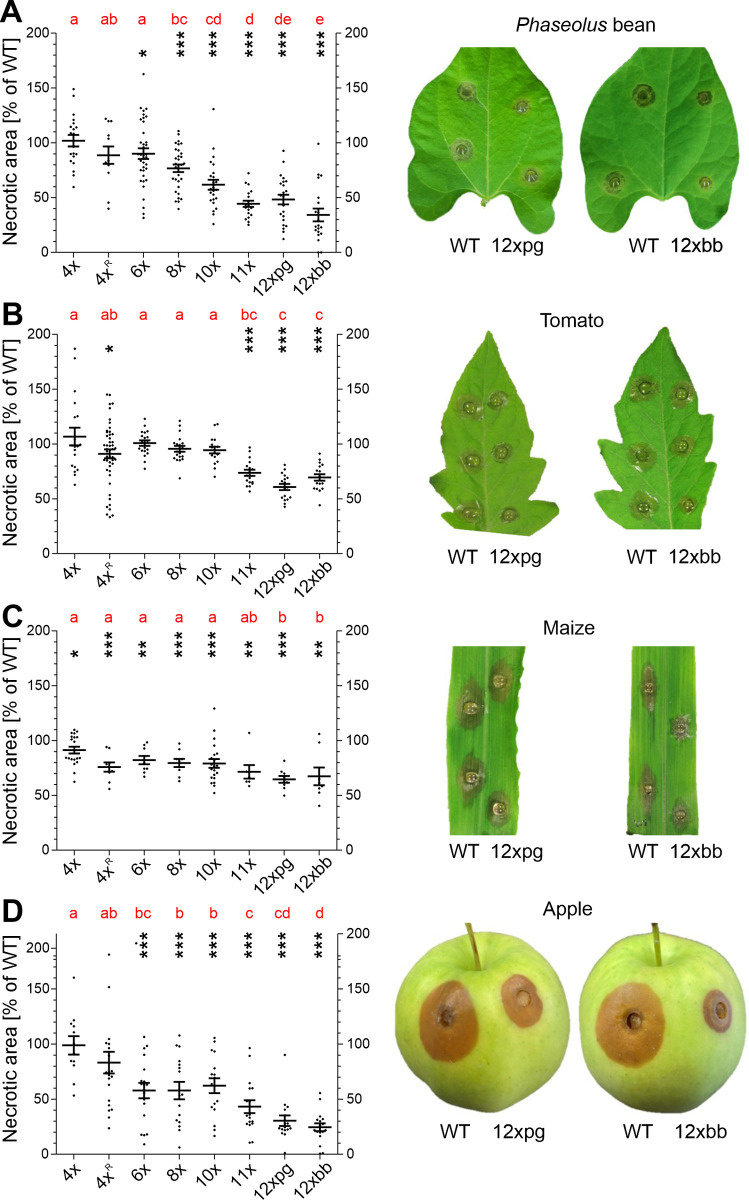
Fig 3. Infection tests of multiple CDIP/ phytotoxin mutants on different host tissues.
A: Attached Phaseolus bean leaves (48 h.p.i.). B: Detached tomato leaves (48 h.p.i.). C: Detached maize leaves (72 h.p.i.). D: Apple fruits (96 h.p.i.). The p values by one-sample t test to a hypothetical value of 100% (WT) are shown, indicating significant reductions of the mutants compared to WT lesions. * p < 0.05; ** p < 0.01; *** p < 0.001. For comparison of the mutants, results of a one-way ANOVA and Tukey’s post hoc test are displayed with compact letter display. The pictures show lesions caused by 12xbb and 12xpg mutants in comparison to WT.

