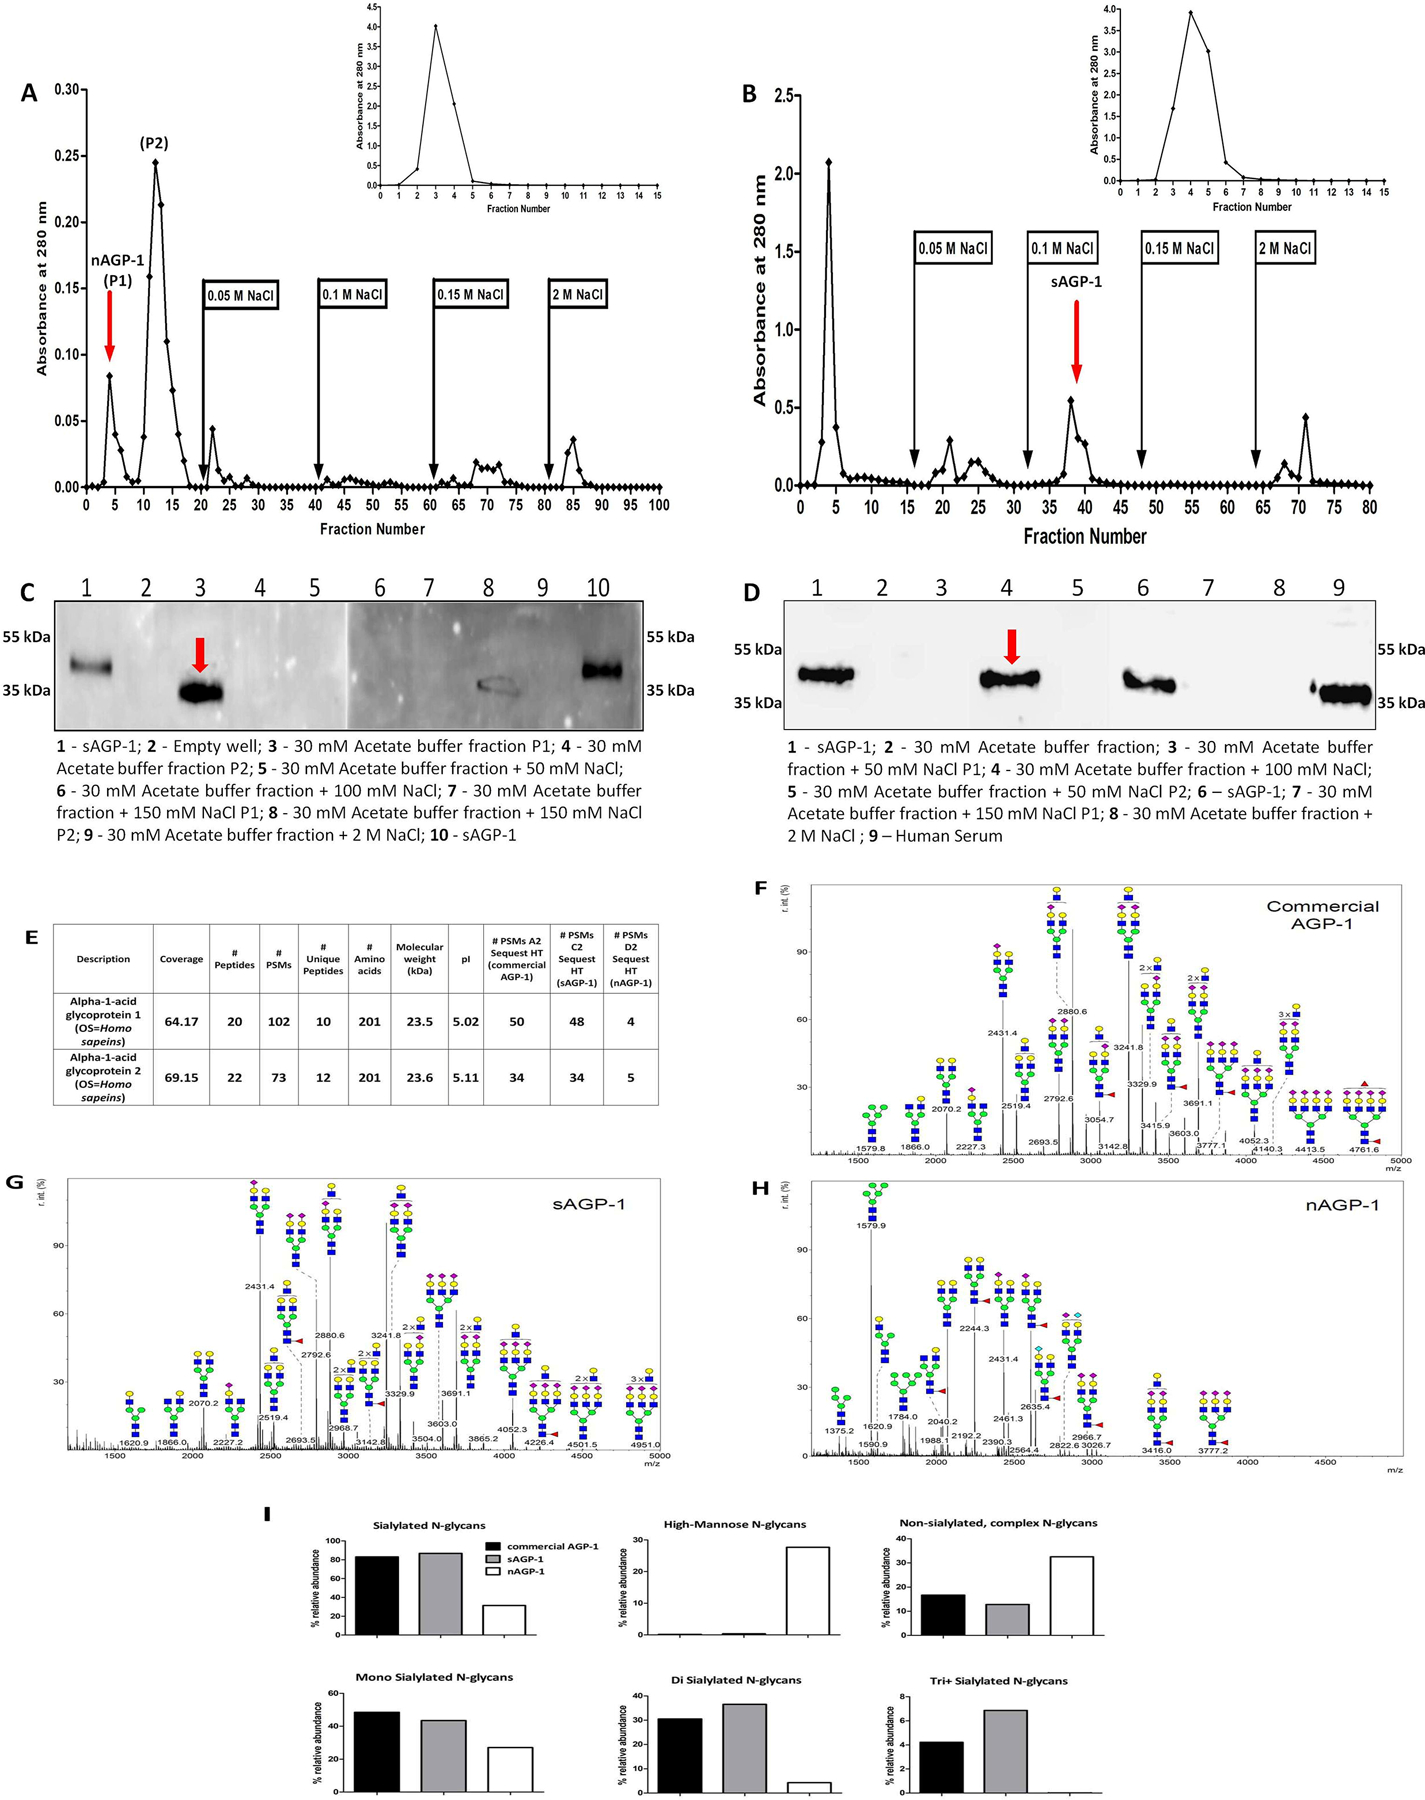
Fig. 2: Purification and characterization of nAGP-1 in comparison with sAGP-1:

Elution profile of (A) PAF-induced Neutrophil supernatant (nAGP-1) and (B) serum derived AGP-1 (sAGP-1) on DEAE-Cellulose column. The insets represent the elution profile of nAGP-1 (A inset) and sAGP-1 (B inset) on Cibacron blue column respectively. The fraction(s) containing the respective AGP-1 is indicated by red arrow. (C) and (D) Western blotting analysis of different fractions of DEAE-cellulose column against nAGP-1 and sAGP-1 respectively (two different gels) indicated by red arrow. (E) Mass spectral analysis of commercial AGP-1, sAGP-1 and nAGP-1. The data revealed that the protein components of the two AGP-1s are identical. Glycomic analysis of (F) commercial AGP-1 and (G) sAGP-1 showed that these two preparations are similar. (H) nAGP-1 differed in glycosylation complexity and composition when compared to sAGP1.  - N-Acetyl Glucoseamine;
  - Mannose;
  - Galactose;
  - Fucose;
  - Sialic acid. (I) % relative abundance of sialylated, non-sialylated, high-mannose, mono- di- and tri+ - sialylated N-glycans present in commercial AGP-1, sAGP-1 and nAGP-1.
