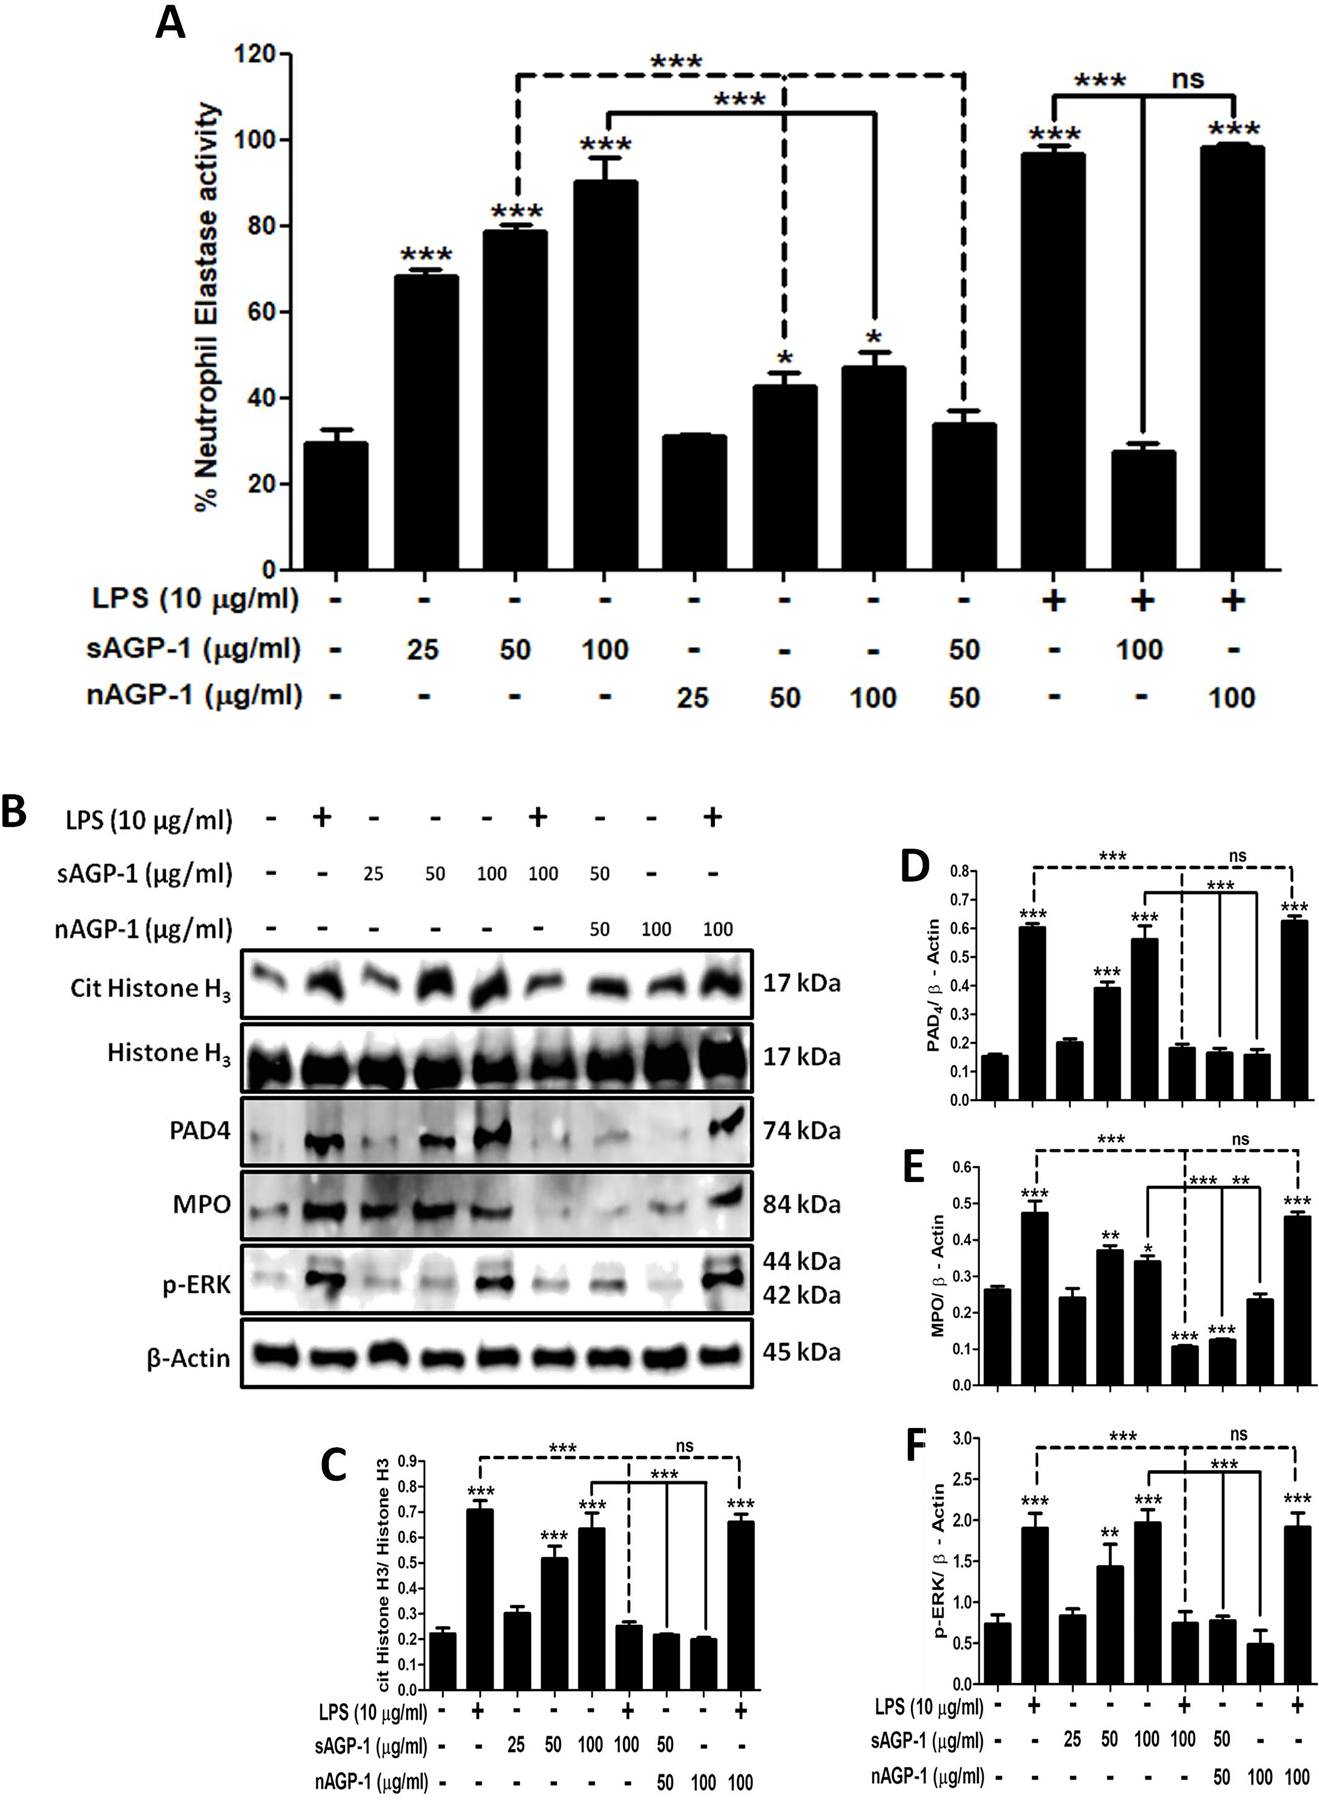
Fig. 5: Profiling of sAGP-1 - induced NETosis:

(A) Quantification of NETosis. Apart for the high-throughput method, NETosis was also quantified by using NETosis assay kit. Neutrophils were stimulated with LPS (10 µg/ml), sAGP-1 and/ or nAGP-1 (25, 50, and 100 µg/ml). In addition neutrophils were also treated with combination of LPS (10 µg/ml), sAGP-1 (100 µg/ml) and/ or nAGP-1 (100 µg/ml) and sub-maximal concentration of sAGP-1 and nAGP-1 (50 µg/ml) (B) Immunoblots for markers of NETosis. Immunoblots for the key markers of NETosis like cit His H3, PAD4, MPO and phospho-ERK was performed. sAGP-1 – induced the expression of the key markers of NETosis in a concentration-dependent manner, while it inhibited LPS – induced expression of these proteins. Although, nAGP-1 failed to induce expression of these proteins even at highest concentration (100 µg/ml), sub-maximal concentration of nAGP-1 (50 µg/ml) inhibited sAGP-1 (50 µg/ml) – induced expression of cit His H3, PAD4, MPO and phospho-ERK. (C – F) Densitometric analyses of NETosis immunoblots. Densitometric analysis of blots obtained from 3 experiments was done using ImageJ software (ver. 1.51j8). The data shown are mean ± SEM. ***p<0.0001, *p<0.01 as determined by one – way ANOVA.
