. 2022 Mar 2;11:e75540. doi: 10.7554/eLife.75540

Figure 1. Intrinsic neural timescales estimated from functional magnetic resonance imaging (fMRI) and electrophysiology reveal a similar hierarchical ordering of cortical and subcortical areas.

Group-averaged (N=9) INTs were estimated for each area of interest by averaging across voxels. Each color represents a hierarchy estimated from a different electrophysiology data set (Left). The hierarchies estimated from spiking data were replicated via fMRI (Right). Somatosensory (A) and visual (B) hierarchies reported by Murray et al., 2014. Note: Each symbol represents a different data set as originally reported by the respective authors. Frontal hierarchy reported by Fascianelli et al., 2019 and Cirillo et al., 2018 (C). Frontal hierarchy reported by Cavanagh et al., 2016 (D). Medial prefrontal hierarchy reported by Maisson et al., 2021 (E). Subcortical hierarchy reported by Nougaret et al., 2021 (F). The areas were defined bilaterally for each panel to match the recording sites of the data set—the Cortical Hierarchy Atlas of the Rhesus Macaque (Jung et al., 2021) and Subcortical Atlas of the Rhesus Macaque (Hartig et al., 2021) were used when possible (see Supplementary file 1). The hemodynamic INTs were estimated as the sum of the autocorrelation function (ACF) values in the initial positive period—that is, this measurement considers both the number of lags and the magnitude of the ACF values. Hence, the INT does not have a time unit and it is used as a proxy of the timescale of that area, with higher values reflecting longer timescales. See Figure 1—figure supplement 2 for an estimate of the time constant of each area. The INT of individual areas was estimated by taking the average of the voxels’ INT values. The analysis was performed at the group level (N=9). Abbreviations: S1/S2 (primary/secondary somatosensory cortex), MT (middle temporal area), LIP (lateral intraparietal area), OFC (orbitofrontal cortex), LPFC (lateral prefrontal cortex), ACC (anterior cingulate cortex), PMd (dorsal premotor cortex), LOFC (lateral OFC), DLPFC (dorso-lateral PFC), VLPFC (ventro-lateral PFC), PFp (polar prefrontal cortex), vmPFC (ventro-medial PFC), sgACC (subgenual ACC), pgACC (pregenual ACC), dACC (dorsal ACC), GPe (external globus pallidus), STN (subthalamic nucleus). Figure 1—figure supplement 3 depicts single-subject INT stability and similarity and the group-level stability of the INT hierarchies.

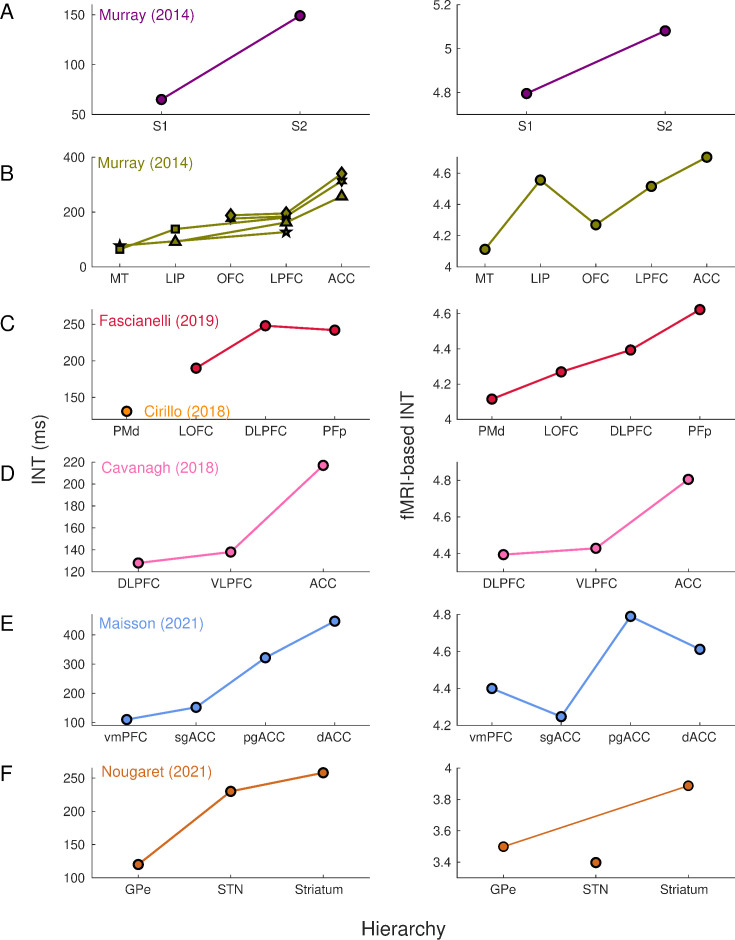
Figure 1.

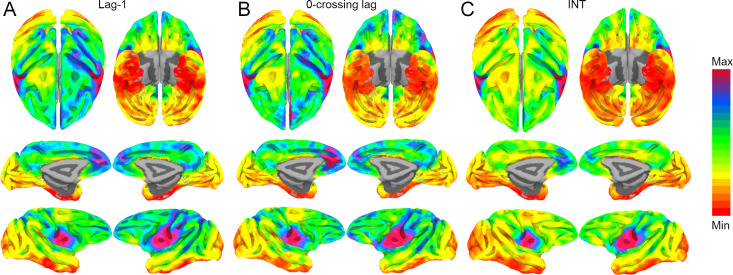
Figure 1—figure supplement 1. Whole-brain hemodynamic intrinsic neural timescales (INTs), lag-1 and 0-crossing lag.

Figure 1—figure supplement 1.

The hemodynamic INTs were estimated as the sum of the autocorrelation function (ACF) values in the initial positive period. This approach considers both the magnitude (quantified as the lag-1 ACF value) and the timescale (quantified as the 0-crossing lag). To examine whether one of these components is a stronger driver of our INT measurement, the lag-1 ACF value ((A); Min: 0.93 – Max: 0.96) and the 0-crossing lag ((B); Min: 5 – Max: 12) were compared to the INTs ((C); Min: 3.3 – Max: 6). The voxel-wise maps were highly correlated: Pearson’s r (A, B): 0.96; Pearson’s r (B, C): 0.97; Pearson’s r (A, C): 0.96. The maps were computed at the group level (N=9). Overall, the magnitude and timescale components of the INTs are highly related. The color bar indicates the lag-1 ACF values, the 0-crossing lag, or INTs. Since the hemodynamic INTs were estimated as the sum of ACF values in the initial positive period, this measurement considers both the number of lags and the magnitude of the ACF values. As a result, the INT does not have a time unit and it is used as a proxy of the timescale of that area, with higher values reflecting longer timescales.
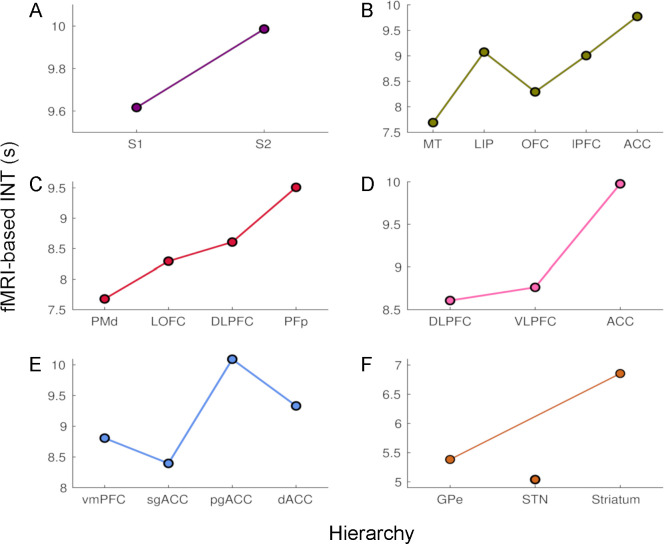
Figure 1—figure supplement 2. The time constants of hemodynamic intrinsic neural timescales (INTs).

Figure 1—figure supplement 2.

The colors are consistent with the hierarchies from Figure 1. The time constant was operationalized as the 0-crossing lag multiplied by the repetition time (TR=1.1 s). The relative ordering of the areas is consistent with that based on our INT measure. The analysis was performed at the group level (N=9). Abbreviations: S1/S2 (primary/secondary somatosensory cortex), MT (middle temporal area), LIP (lateral intraparietal area), OFC (orbitofrontal cortex), LPFC (lateral prefrontal cortex), ACC (anterior cingulate cortex), PMd (dorsal premotor cortex), LOFC (lateral OFC), DLPFC (dorso-lateral PFC), VLPFC (ventro-lateral PFC), PFp (polar prefrontal cortex), vmPFC (ventro-medial PFC), sgACC (subgenual ACC), pgACC (pregenual ACC), dACC (dorsal ACC), GPe (external globus pallidus), STN (subthalamic nucleus).
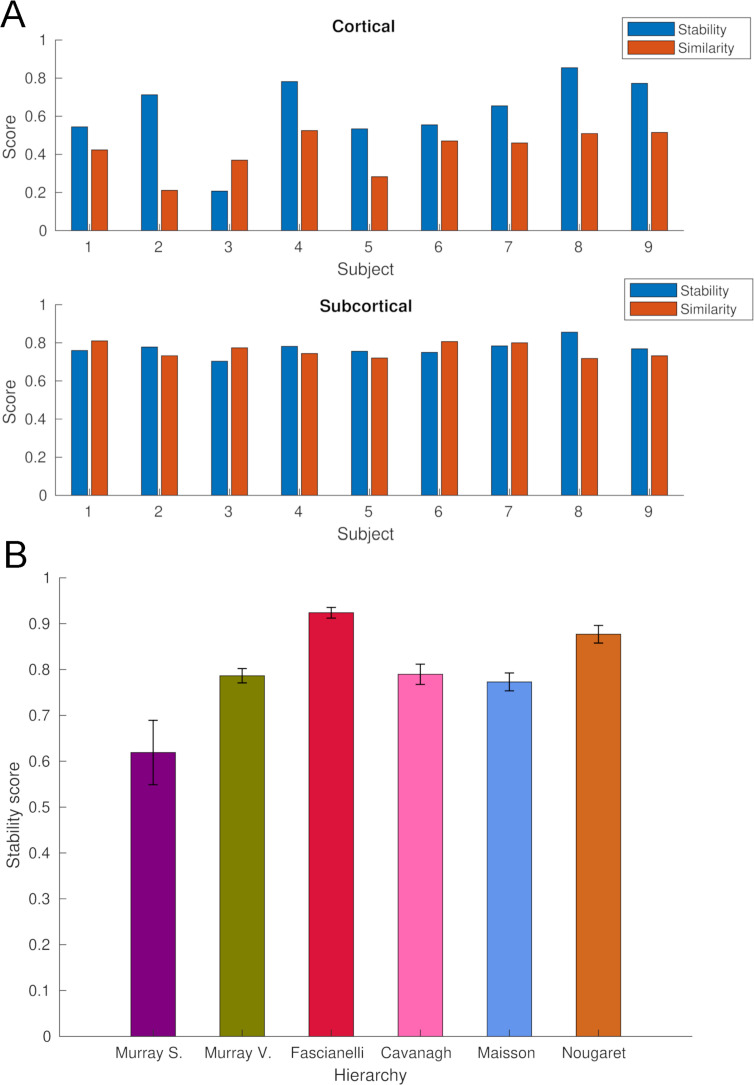
Figure 1—figure supplement 3. Stability and similarity analysis of whole-brain intrinsic neural timescales (INTs).

Figure 1—figure supplement 3.

(A) Single-subject stability and similarity of cortical (Top) and subcortical (Bottom) INTs. The stability score was estimated by averaging Fisher’s Z-transformed pairwise Pearson’s correlation coefficients across runs. The similarity score was estimated by averaging the Fisher’s Z-transformed pairwise Pearson’s correlation coefficients with all the other subjects. (B) The stability of fMRI-based INT hierarchies (see Figure 1). To estimate stability, the hierarchies were re-computed for all the possible combinations of groups of four subjects (n=126) steps. For each step, the Spearman’s rank correlation between the group (N=9, see Figure 1) and the subgroup (N=4) hierarchies was computed. The stability score was estimated by averaging the correlation coefficients across steps. Abbreviations: Murray et al., 2014; Somatosensory hierarchy; Murray et al., 2014; Visual hierarchy; Fascianelli et al., 2019; Cirillo et al., 2018; Cavanagh et al., 2016; Maisson et al., 2021; Nougaret et al., 2021. fMRI, functional magnetic resonance imaging.