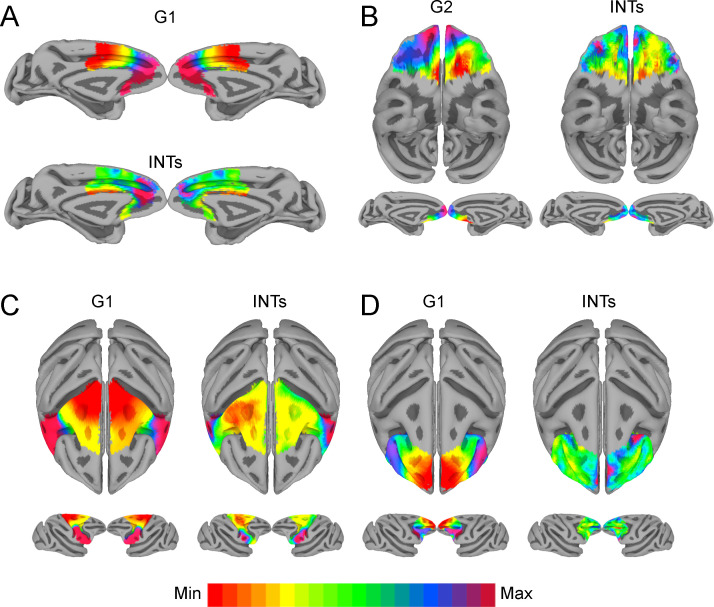
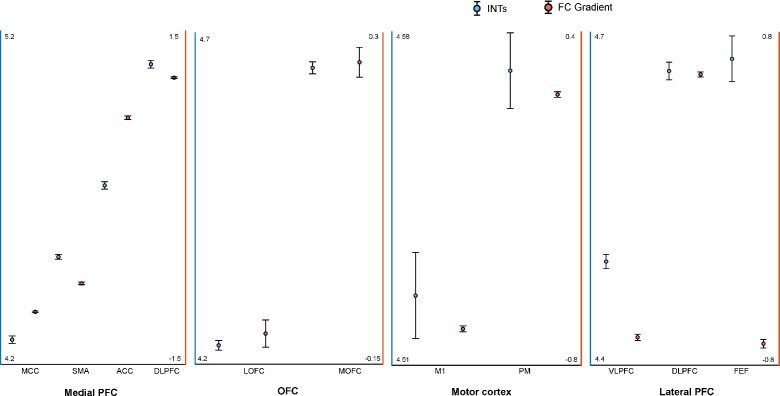
Figure 4. The relationship between functional connectivity (FC) and intrinsic neural timescales (INTs) in the frontal lobe.
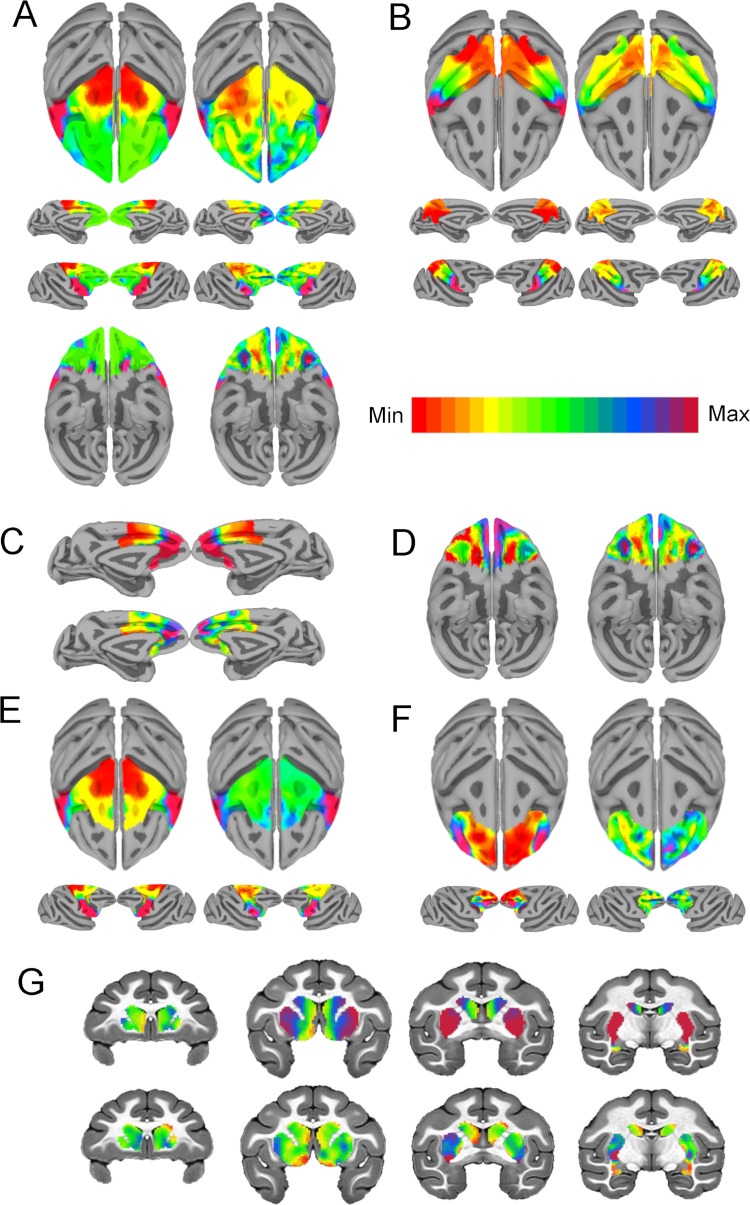
Group-averaged INT maps (Right) and FC gradients (Left) were estimated at the group level (N=9). Gradient 1 (G1) and Gradient 2 (G2) were estimated using a cosine similarity affinity computation of the within-area followed by diffusion mapping (Note: G1 and G2 are the first components that describe the axes of largest variance). The FC gradient with the highest correlation to INTs was plotted. (A) INTs in medial prefrontal cortex were correlated with G1 (r=0.49). (B) INTs in the orbitofrontal cortex were correlated with G2 (r=0.45). (C) INTs in the motor cortex were correlated with G1 (r=0.68). (D) INTs in the lateral prefrontal cortex were correlated with G1 (r=0.35). The color bar indicates the position along the FC gradient (values are on an arbitrary scale) or INT values (Note: since the hemodynamic INTs were estimated as the sum of ACF values in the initial positive period, this measurement considers both the number of lags and the magnitude of the ACF values. As a result, the INT does not have a time unit and it is used as a proxy of the timescale of that area, with larger values reflecting longer timescales). The value ranges differ across panels unless otherwise stated. For a more in-depth analysis of the relationship between INTs and FC, see Figure 4—figure supplement 1. For the single-subject analysis, see Figure 4—figure supplement 2.


