. 2022 Mar 2;11:e75540. doi: 10.7554/eLife.75540

Figure 5. Cortico-striatal functional connectivity (FC) is related to intrinsic neural timescales (INTs).

Group-averaged INT maps and FC gradients (Left) were estimated at the group level (N=9). Gradient 1 (G1) and Gradient 2 (G2) were estimated using a cosine similarity affinity computation of the cortico-striatal FC followed by diffusion mapping (Note: G1 and G2 are the first components that describe the axes of largest variance). Only the gradient with the highest correlation to the striatal INT map was plotted. (A) The striatal FC gradient estimated from cortico-striatal connectivity (Top) and its projection onto the cortex (Bottom) (Note: the same value range was used). The FC patterns underlying the cortico-striatal gradient matched the anatomical connectivity derived from animal invasive tracing. (B) Striatal INTs (Top) and cortical INTs projection based on cortico-striatal FC (Bottom). The striatal and cortico-striatal INT maps were related (r=0.45). Striatal INTs were related to G1 estimated from cortico-striatal connectivity (r=0.38). The color bar indicates the position along the FC gradient (values are on an arbitrary scale) or INT values (Note: since the hemodynamic INTs were estimated as the sum of ACF values in the initial positive period, this measurement considers both the number of lags and the magnitude of the ACF values. As a result, the INT does not have a time unit and it is used as a proxy of the timescale of that area, with larger values reflecting longer timescales). The value range differs across panels unless otherwise stated.

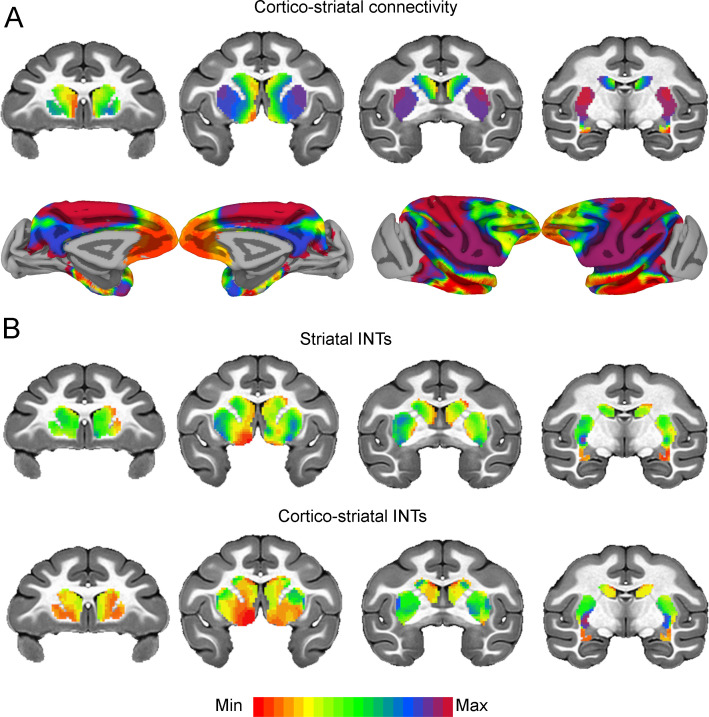
Figure 5.

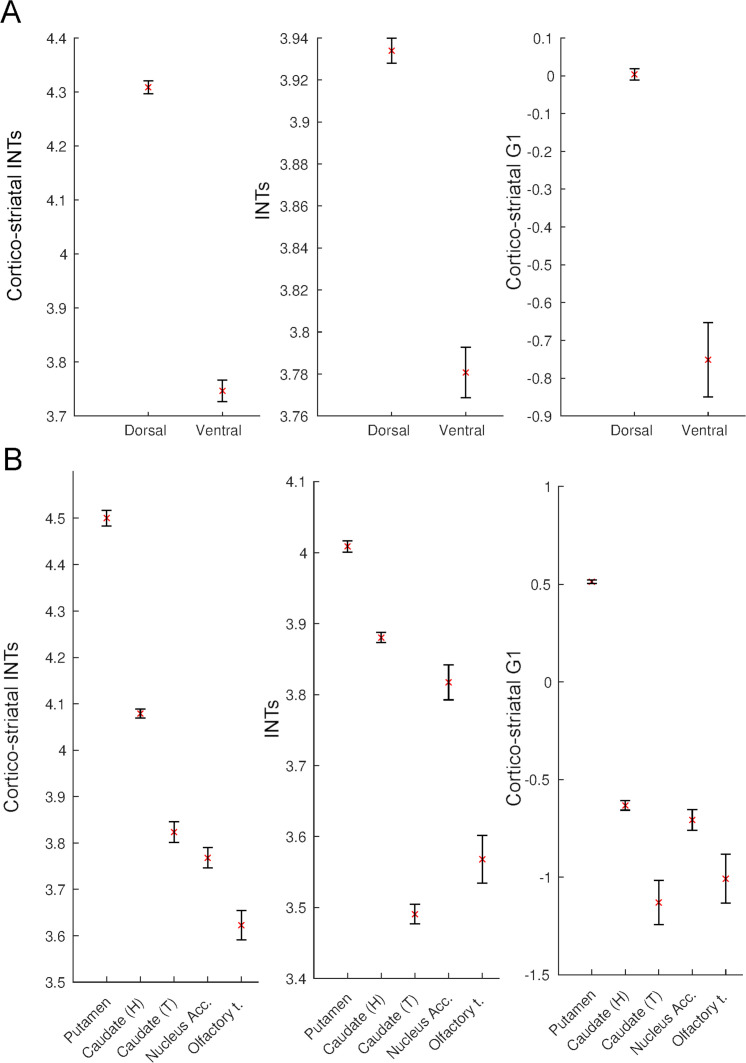
Figure 5—figure supplement 1. Intrinsic neural timescales (INTs) and functional connectivity (FC) gradients are monotonically related in the striatum.

Figure 5—figure supplement 1.

For a better interpretation of the relationship between the striatal and cortico-striatal INT maps and FC gradients, the INT/gradient values were averaged across voxels within the functional subdivisions of the striatum. The functional subdivisions were defined based on the Subcortical Atlas of the Rhesus Macaque (SARM; Hartig et al., 2021). The error bars represent 2*Standard Error (SE; calculated as the standard deviation divided by the square root of the number of voxels). (A) Dividing the striatum into its major functional subdivisions revealed that for both striatal and cortico-striatal INTs and FC, there is a dorsal to ventral axis of change. The dorsal striatum had the slowest and ventral striatum the fastest timescales, which was reflected in both the striatal and cortico-striatal INTs. (B) A finer subdivision of the striatum reveals a similar ventro-dorsal but also medio-lateral axis of change across the three maps. While the striatal INTs and the FC gradient have a very good correspondence, the head of the caudate in the cortico-striatal INT map deviates from this pattern—that is, it has higher values relative to the other structures in the ventral striatum. The plots are based on the INT and gradient maps derived at the group level (N=9). Note: since the hemodynamic INTs were estimated as the sum of ACF values in the initial positive period, this measurement considers both the number of lags and the magnitude of the ACF values. As a result, the INT does not have a time unit and it is used as a proxy of the timescale of that area, with larger values reflecting longer timescales. Abbreviations and SARM codes: Caudate (H) (head of the caudate; Level 6 Code 46); Caudate (T) (tail of the caudate; Level 6 Code 47); Nucleus Acc. (nucleus accumbens; Level 6 Code 52); Olfactory T. (olfactory tubercule; Level 6 Code 53), Dorsal Striatum (Level 4 Code 44), Ventral Striatum (Level 4 Code 51), G1 (Gradient 1).