. 2022 Mar 15;11:e63404. doi: 10.7554/eLife.63404

Figure 1. Absolute quantification of E74 induction and transcriptional memory.

(A) Overview of ecdysone/20E treatment. Cells were treated with 5 μM 20E, then washed with fresh media and recovered for 24 hr. Memory response was assessed by incubating cells with 5 μM 20E after recovery period. (B). Absolute number of E74 mRNAs per cell as a function of time after the addition of 20E during either the first or second induction in control (dsWhite) and Nup98 knockdown (dsNup98) S2 cells. Samples were collected every 30 min. Error bars represent standard deviation of the mean of three experiments. (C). Schematic of smFISH labeling of sites of nascent transcription and spliced transcripts in either the nucleus or cytoplasm. (D). Representative images of E74 smFISH labeling in single cells during the first and second induction, displayed with the ImageJ ‘red fire’ look-up table. (E). Violin plots of E74 puncta per cell. Mean and median indicated by black and red horizontal lines.

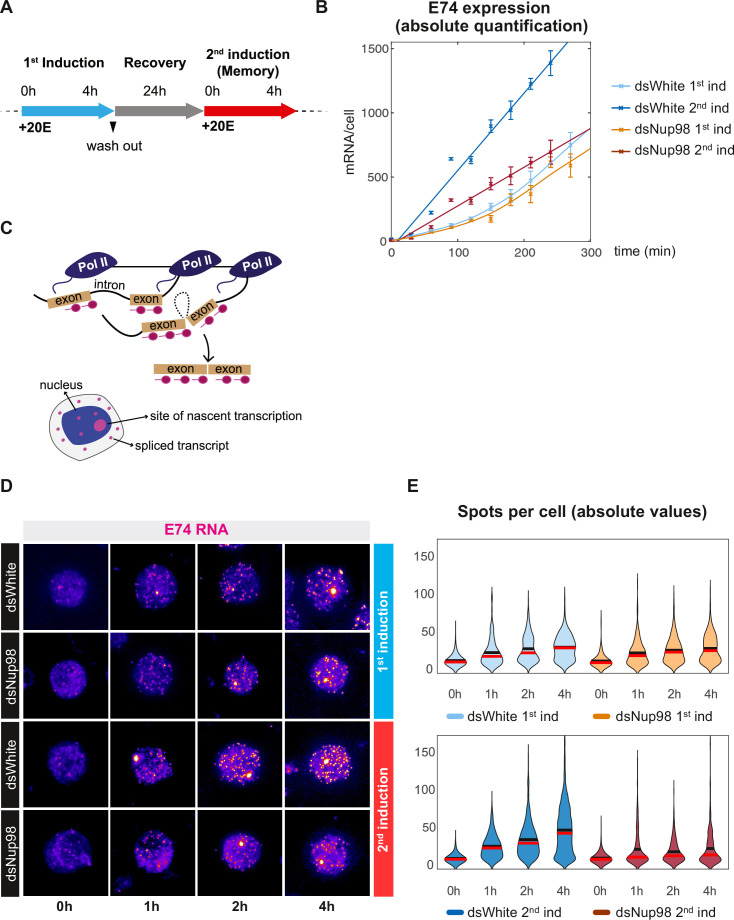
Figure 1.

Figure 1—figure supplement 1. Absolute quantification of E74 expression.

Figure 1—figure supplement 1.

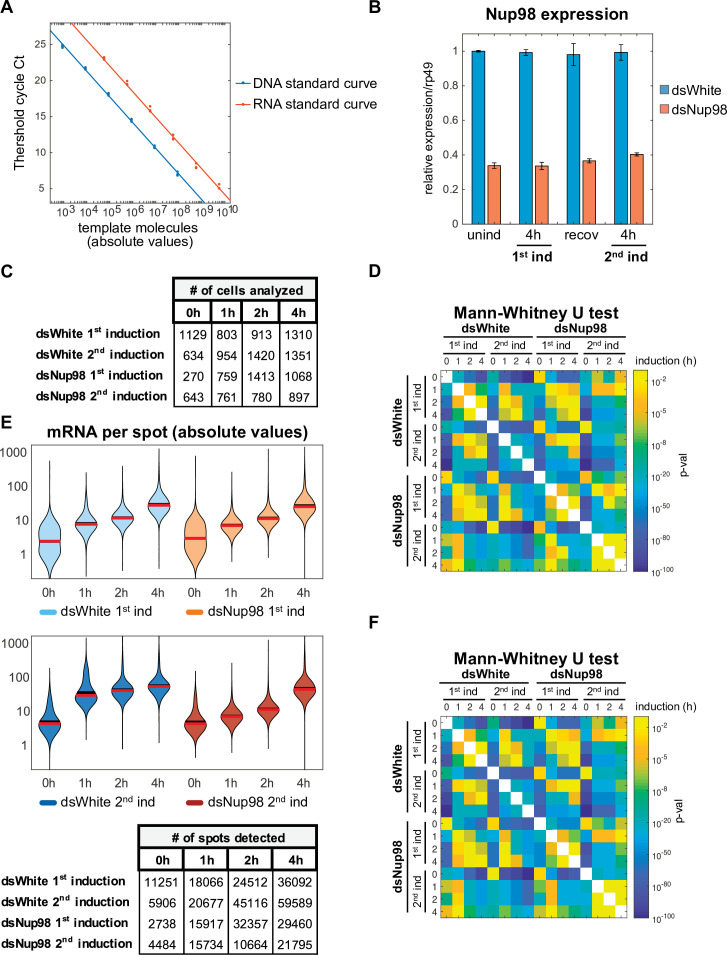
(A) Calibration of qPCR using known numbers of input DNA or in vitro transcribed RNA molecules. Ct (cycle threshold) refers to the number of cycles required for the fluorescent signal to cross the threshold at which all samples are compared. Note that the protocol is accurate across more than 6 orders of magnitude. (B). Nup98 expression was assessed relative to rp49 by qPCR following the experimental conditions detailed in Figure 1B. Error bars represent standard deviation. (C). Number of cells analyzed in Figure 1D. (D). p-Values for all possible pairwise comparisons of spot count distributions shown in Figure 1E were determined using the non-parametric Mann-Whitney U test. (E). Quantification of numbers of mRNA per spot detected by smFISH. Mean intensities of cytoplasmic puncta under uninduced conditions were used to normalize intensities of puncta under induction. Mean and median indicated by black and red horizontal lines respectively. (F). p-Values for all possible pairwise comparisons of mRNA per spot distributions shown in panel E were determined using the non-parametric Mann-Whitney U test.
Figure 1—figure supplement 2. Analysis of E74 smFISH resolution.

Figure 1—figure supplement 2.

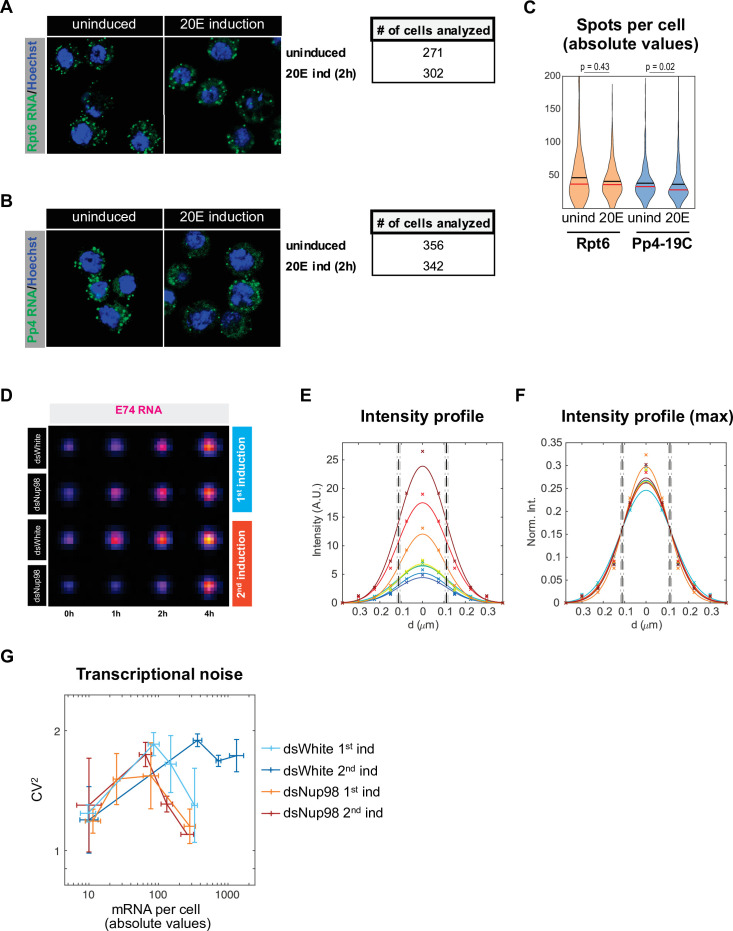
(A-C) Representative images (A,B) and violin plots (C) for Rpt6 expression (A) and Pp4-19C expression (B) in uninduced and 20E induction. Mean and median indicated by black and red horizontal lines respectively. Mann-Whitney U test was used to compare similarities between uninduced and induced samples. (D–F). E74 smFISH spots are diffraction limited. (D): average images of all spots for each of 16 conditions displayed with the ‘red fire’ look-up table. (E, F) Cross-section of the eight images for control (dsWhite) are plotted with mean pixel values demarcated by symbols and fitted Gaussians as solid lines for either raw mean pixel values (E) or normalized such that the total area under each Gaussian equals unity (F). Vertical lines represent mean (dashed) and standard deviation (dot-dashed) of the full width at half maximum (FWHM, 110 ± 5 nm), essentially equivalent to the radius of a diffraction-limited object predicted from the Abbe limit (emission wavelength / numeric aperture = 105 m) independent of spot intensity. (G). Transcriptional noise, plotted as coefficient of variation CV (or standard deviation/mean) squared, as a function of mean number of mRNA molecules per cell, was assessed in control and Nup98 knockdown conditions in the first and second inductions. Error bars represent the standard deviation of the mean.