. 2022 Mar 15;11:e63404. doi: 10.7554/eLife.63404

Figure 3. The two-state promoter model does not describe single-cell measurements of transcription.

(A) A model utilizing two promoter states (active and inactive) contains two mechanisms that can account for the increase in the transcription rates observed by qPCR. Model 1: loci are slowly recruited into a transcriptionally active state upon first induction and more rapidly upon second induction. Once active, loci produce new mRNAs at a constant rate equivalent to the rate at which new RNA Pol II molecules enter productive elongation. Model 2: all cells are rapidly recruited into an active state, and the rate of transcription increases over time, slowly upon first induction and quickly upon second induction. (B). Model describing the rate of recruitment into the active state kA, into the inactive state k-A, and the rate of recruiting RNA Pol II molecules into productive elongation kPol. The presence of 20E permits kA to be larger than k-A. The production rate as a function of time is given by the RNA Pol II recruitment rate multiplied by the fraction of active loci. In Model 1, kA increases and kPol is constant during 20E exposure, whereas in Model 2, kPol increases and kA is constant. (C–N). Histograms (cyan) show distribution of measured total instantaneous transcriptional activity in normalized units (C.U.), obtained from smFISH of E74 as shown in Figure 1. Lines represent predicted values generated by simulation using best-fitting parameters for Model 1 (green) and Model 2 (magenta) under conditions of control (C–H) or Nup98 knockdown conditions (I–N) during the first (C,F,I,L), second (D,G,J,M), or fourth (E,H,K,N) hour of the first (C–E, I–K) or second (F–H, L–N) inductions.

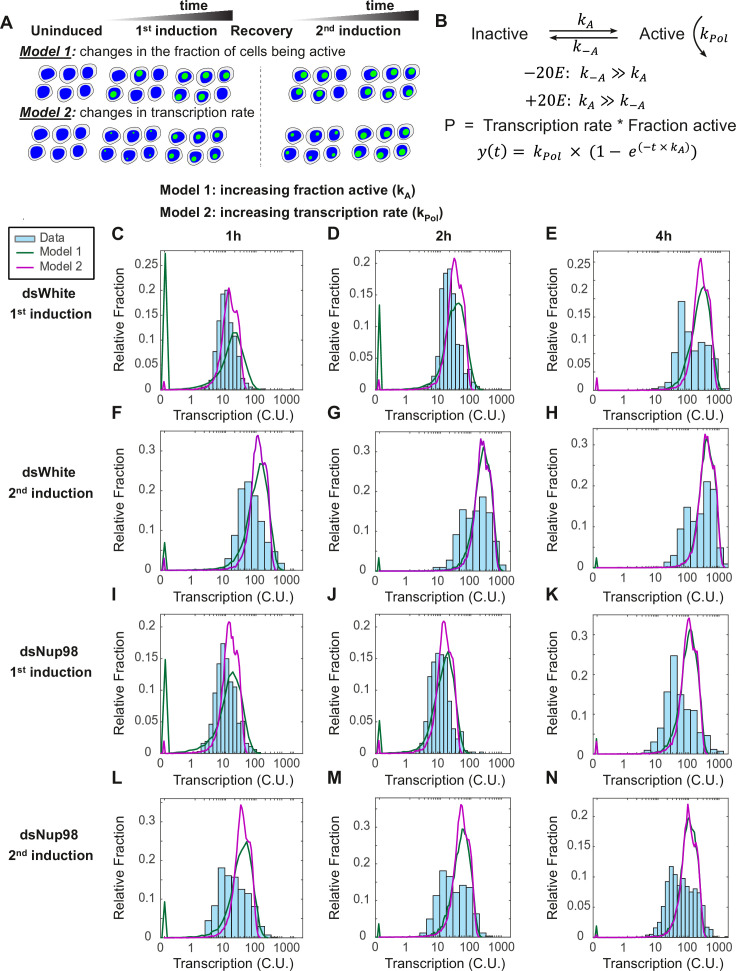
Figure 3.

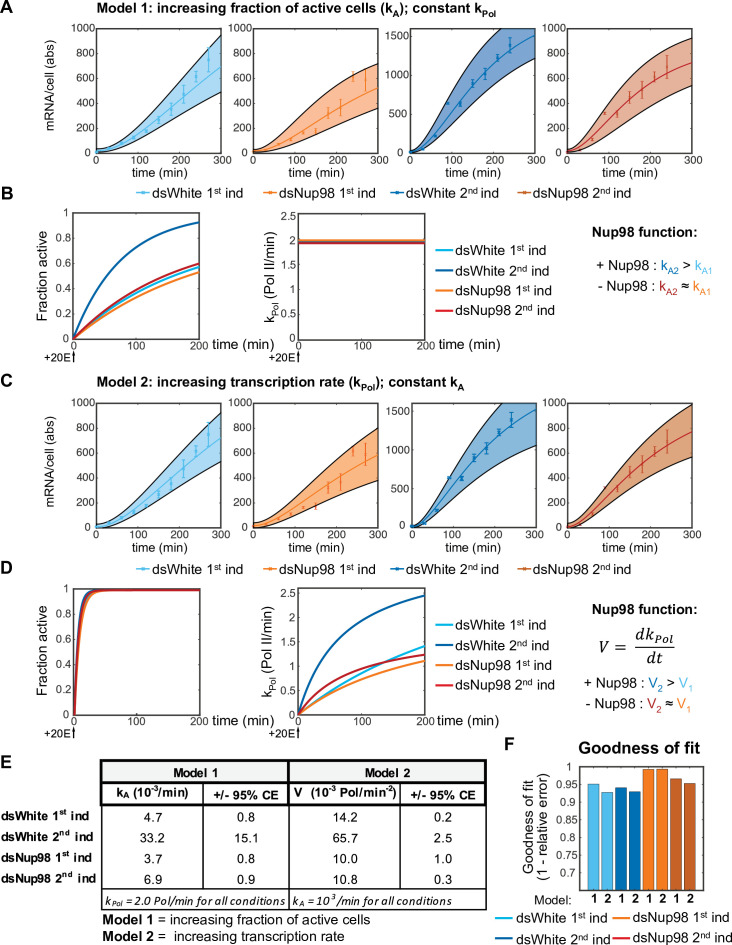
Figure 3—figure supplement 1. Modeling promoter state switching and increasing transcription rates using population-averaged qPCR data.

Figure 3—figure supplement 1.

(A). Best fit and 95% confident intervals of Model one to qPCR data. (B). Under Model 1, normal levels of Nup98 are required to ensure kA2 > kA1, yielding a faster recruitment of loci into the active state (left) upon second induction, whereas kPol is constant under all conditions (2.0±0.2 RNA Pol min–1). (C). Fit of Model two to data. (D). Under Model 2, kA is large and essentially identical between conditions (left), ensuring near-simultaneous activation of all loci (left). The role of Nup98 is to ensure a rapid increase in kPol upon second induction. (E). Best-fitting values and 95% confidence intervals for a Model 1 (constant kPol) and Model 2 (increase in kPol as a function of time). (F). Goodness-of-fit values for each of the two mechanisms of increasing the transcription rate under an assumption that k-A = 0. Values calculated as described in the legend to Figure 2—figure supplement 1C.
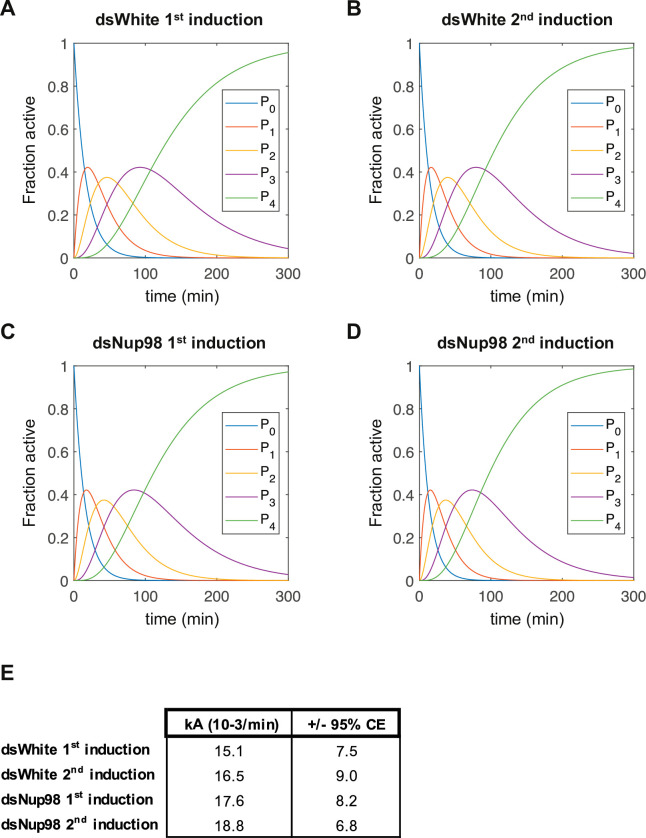
Figure 3—figure supplement 2. Estimated population distributions of cells with 0–4 nascent transcription sites as a function of time.

Figure 3—figure supplement 2.

(A-D) Estimated fraction of cells with inactive (P0) or 1,2,3, or 4 active transcription sites (P1–P4) under the first or second induction in control or Nup98 knock-down conditions, as indicated. Curves are generated using the rate of entering the active state derived from fitting data from each individual condition separately and with the same method as for fitting all conditions simultaneously, described in Figure 4—figure supplement 1 and accompanying text and methods. (E). Obtained kA values for fitting each of these conditions.