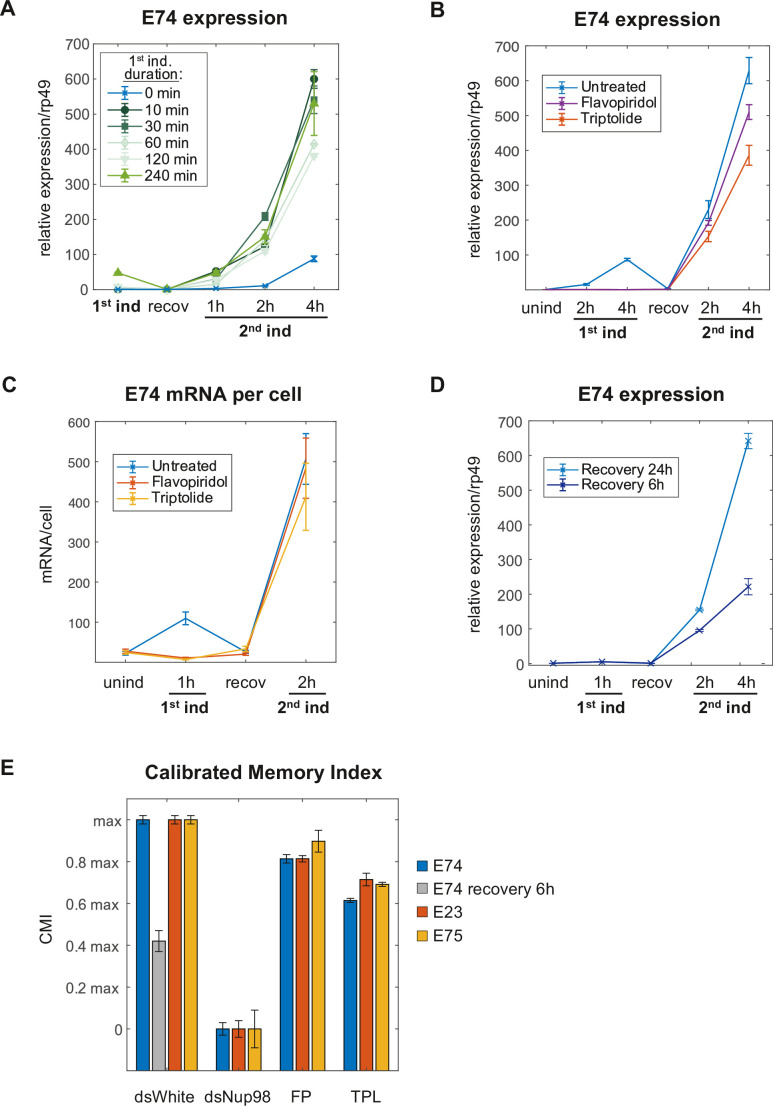
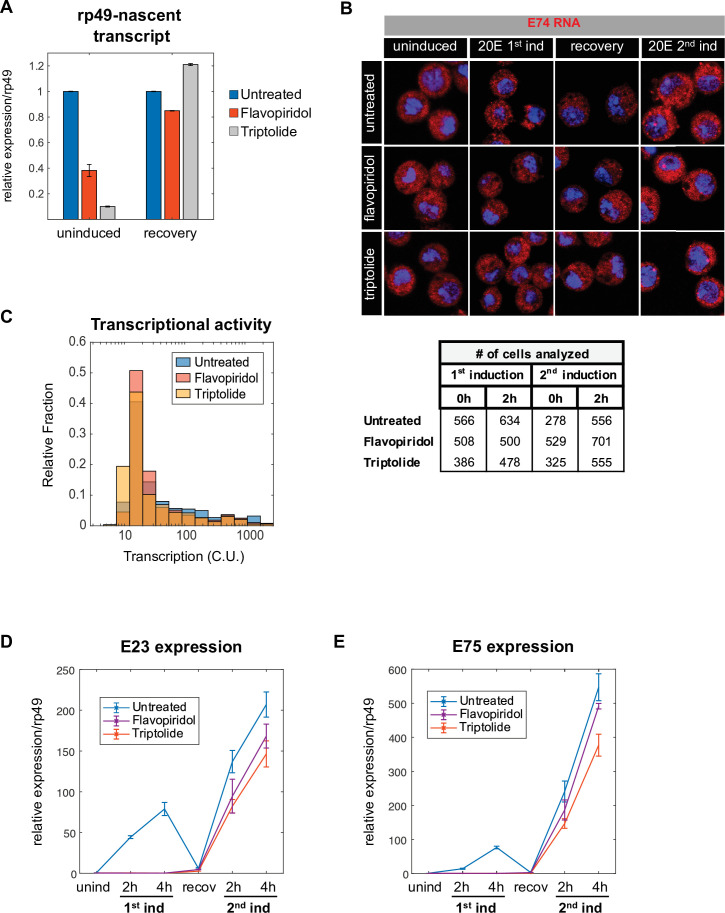
Figure 5. Induction of the memory state requires neither transcription nor prolonged 20E exposure.
(A) E74 mRNAs measured by qPCR and normalized relative to rp49 with varying duration of 20E exposure during first induction. The data represent the mean of three independent experiments and the error bars the standard deviation of the mean. (B). Flavopiridol or Triptolide inhibitors were added 30 min prior 20E first induction at 1 μM and 5 μM, respectively. After 4 hr of induction, both, the hormone and the transcriptional inhibitors were washed-out and cells recovered for 24 hr. 20E re-induced cells were collected and, E74 expression was measured by qPCR from three independent experiments. Fold change values were normalized using rp49 and error bars represent the standard deviation of the mean. (C). Cells were treated with Flavopiridol or Triptolide as described in B and E74 mRNAs were monitored by smFISH. Error bars represent standard deviation of the mean. (D). E74 mRNAs levels were measured by qPCR and normalized against rp49 using two different recovery times (6 hr and 24 hr). The data represent the mean of three independent experiments ± standard deviation. (E). Calibrated Memory Index (CMI) of E74, E23, and E75 genes.


