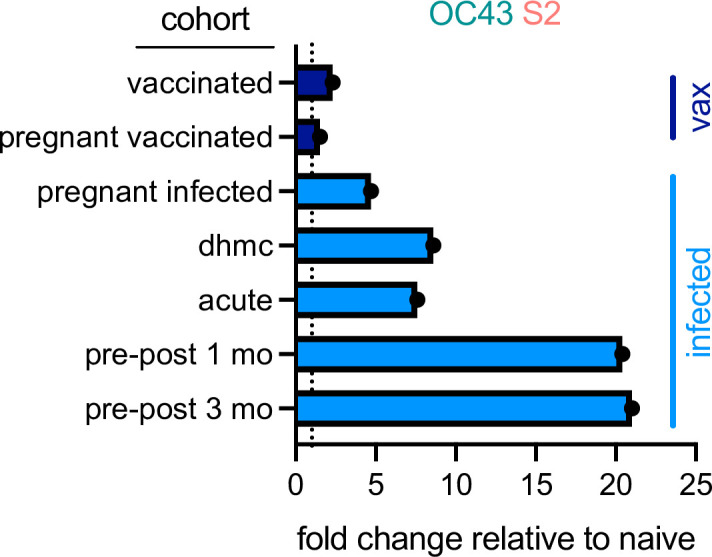
Figure 8. Differential boosting of responses to OC43 S2 by vaccination and natural infection.

Mean fold changes in the magnitude of the IgG response to OC43 S2 between the indicated cohort and naïve control subjects, or median fold change between pre- (naïve) and post-infection timepoints (pre-post cohort at 1 and 3 months) for the longitudinal cohort. Dotted line indicates no change. Vaccinated (vax) and infected cohorts are indicated in dark and light blue, respectively.
