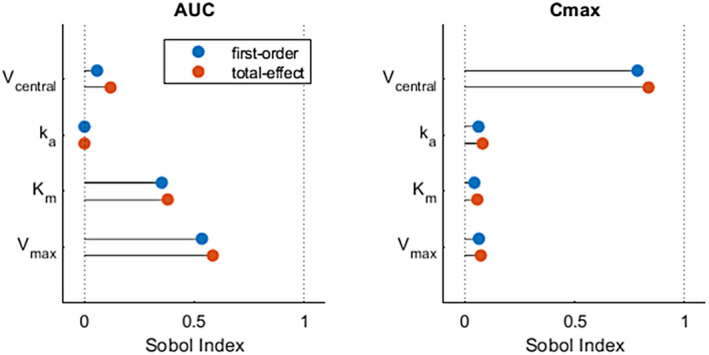
FIGURE 3.

This figure shows how the choice of quantity of interest (QOI) can impact the outcome of a sensitivity analysis. Both panels show results from the same Sobol GSA as in Figure 2, with AUC and Cmax calculated for the 24 h after a single dose. Each panel uses a different QOI to assess the sensitivity of the QOI to various input parameters. In the left panel, the AUC of the drug concentration is used as the QOI and is shown to be highly sensitive to Vmax but not k a. However, when the maximum drug concentration (Cmax) is used as the QOI, it shows that Cmax is much less sensitive to Vmax and marginally sensitive to k a. Analyses performed using MATLAB and SimBiology R2020b; code available in the supplementary information. AUC, area under the curve; k a, absorption rate constant; Km, Michaelis constant; Vmax, maximal elimination rate
