
Figure 4.
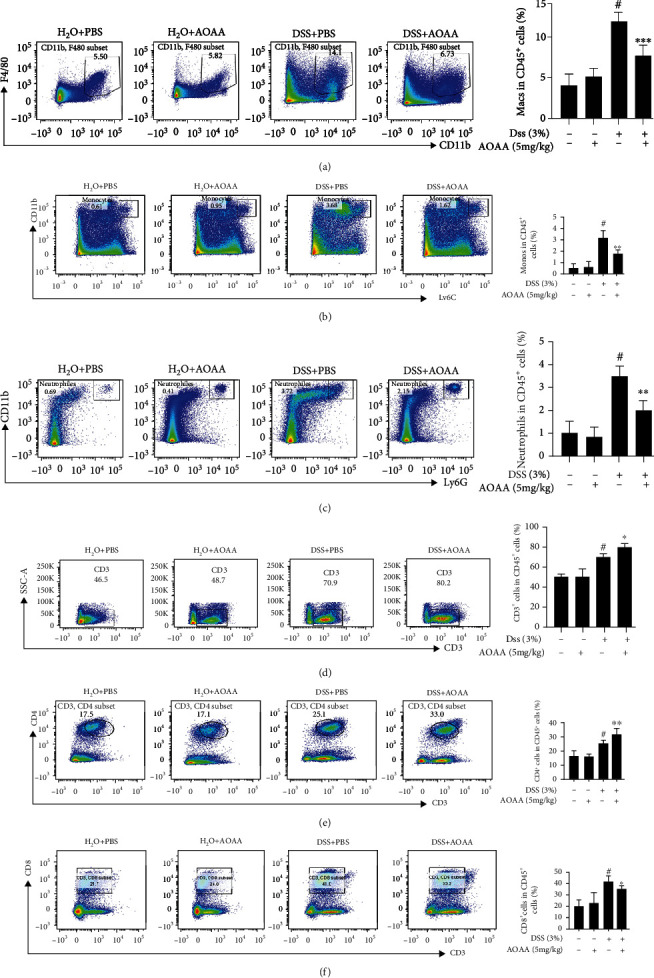
AOAA restored the changes of intestinal local immune pattern of DSS-induced colitis. The percentage of (a) macrophages (CD11b+ and F4/80+ cells), (b) monocytes (CD11b+ and Ly6c+ cells), and (c) neutrophils (CD11b+ and Ly6G+ cells), (d) T cells (CD3+ cells), (e) CD4+ T cells (CD3+ and CD4+ cells), and (f) CD8+ T cells (CD3+and CD8+ cells) in colonic LP were examined by FACS analysis. One representative experiment of three is shown. Data in (a–f) (right panels) are shown as mean ± SD (n = 5) (#P < 0.05 vs. the H2O+PBS group; ∗P < 0.05, ∗∗P < 0.01, and ∗∗∗P < 0.001 vs. the DSS+PBS group).