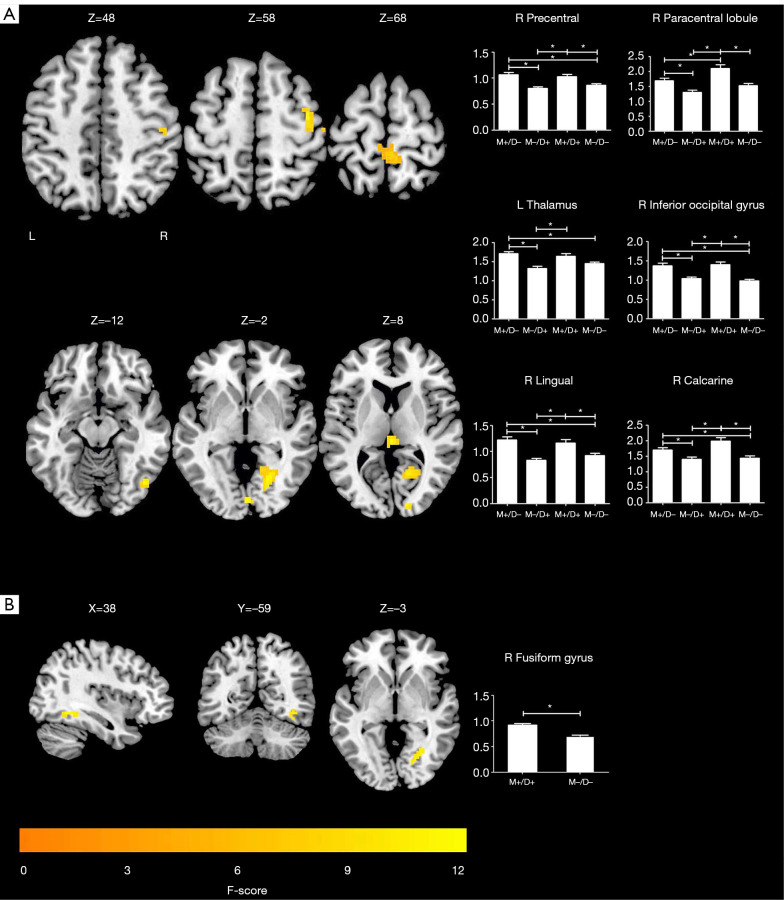
Figure 1.
ALFF analysis among the 4 groups. (A) One-way ANOVA analysis on ALFF among the 4 groups. (B) Two-sample t-test on ALFF between M+/D+ and M−/D−. On the right, the histograms exhibit the mean ALFF value by group (error bars represent standard error from the mean) in each identified ROI. *, P<0.05 (Bonferroni-corrected). M+/D+: patients with comorbid migraine and depression; M+/D−: patients with migraine; M−/D+: patients with major depressive disorder; M−/D−: healthy controls. ALFF, amplitude of low-frequency fluctuations; ROI, region of interest; L, left; R, right; ANOVA, analysis of variance.

