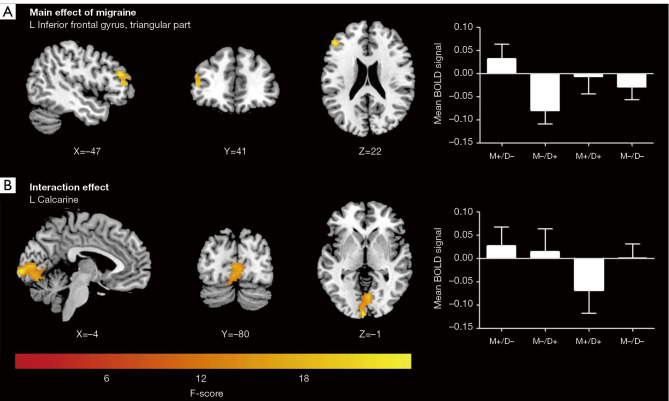
Figure 4.
Two-way ANOVA analysis on brain function among the 4 groups. (A) Significant main effect of migraine in the left inferior frontal gyrus, triangular part. (B) Significant interaction effects between migraine and depression in the left calcarine sulcus. On the right, the histogram exhibits the mean BOLD signal by group (error bars represent standard error from the mean). M+/D+: patients with comorbid migraine and depression; M+/D−: patients with migraine; M−/D+: patients with major depressive disorder; M−/D−: healthy controls. L, left; ANOVA, analysis of variance; BOLD, blood-oxygen-level-dependent.

