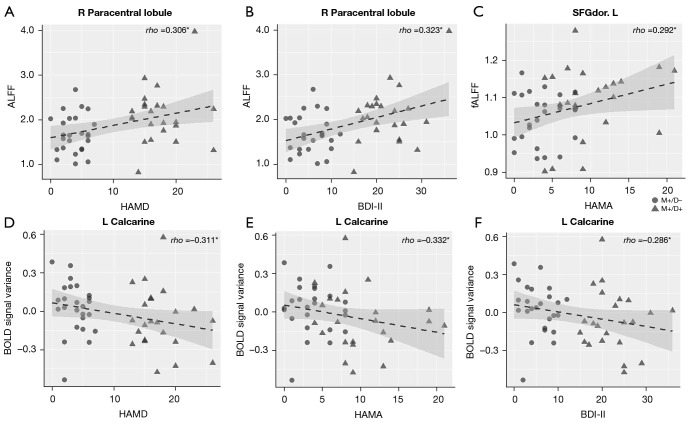
Figure 5.
Scatter plots of correlations between brain function and clinical variables in the M+ patients. /D+ and /D− groups are shown separately. (A-C) Positive correlations between brain function alteration (ALFF, fALFF) values and clinical variables (HAMD, BDI-II, and HAMA). (D-F) Negative correlations between BOLD signal variance and HAMD, HAMA, and BDI-II. *, P<0.05. M+/D−: patients with migraine; M+/D+: patients with comorbid migraine and depression. ALFF, amplitude of low-frequency fluctuations; rho, spearman correlation coefficient; HAMD, Hamilton Rating Scale for Depression; HAMA, Hamilton Rating Scale for Anxiety; BDI-II, Beck Depression inventory-II; L, left; R, right; BOLD, blood-oxygen-level-dependent.

