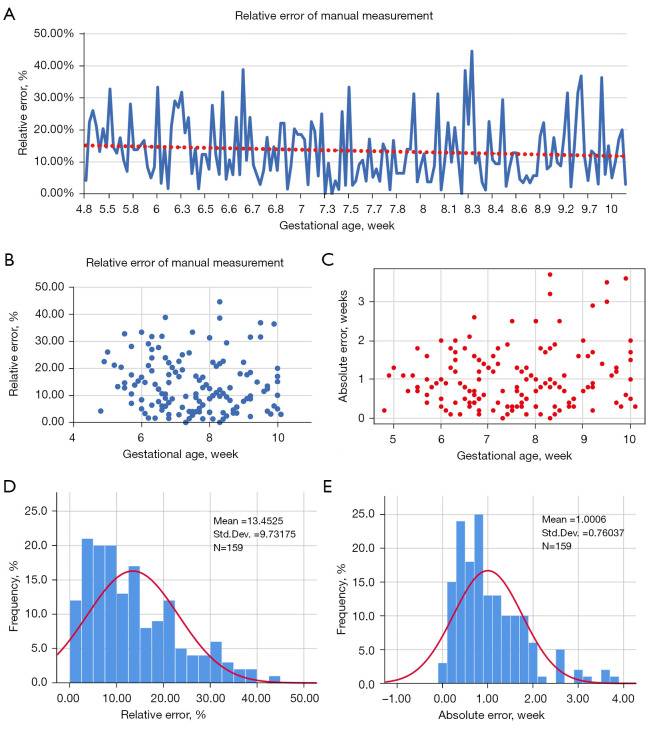
Figure 5.
Analysis of clinician error and gestational age. (A) Relative error of manual assessment according to GA. The red dashed line means the trend line of relative error. (B,C) Scatter plots of relative (B) and absolute (C) errors. (D,E) Histograms showing the probability density distribution of relative (D) and absolute (E) errors. GA, gestational age.

