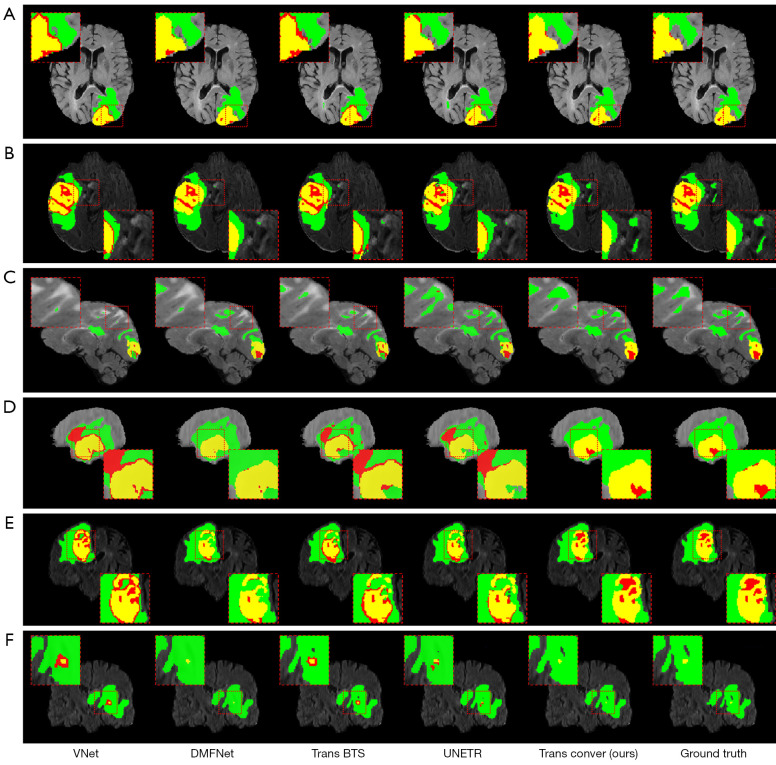
Figure 10.
The visual comparison of MRI brain tumor segmentation results. (A) and (B) for cross section, (C) and (D) for sagittal cross section, (E) and (F) for coronal cross section. The green region, yellow region and red region represent peritumoral edema, enhanced tumor and necrotic tumor, respectively. Among them, WT consists of green, red and yellow region, TC consists of red and yellow region, ET consists of yellow region. MRI, magnetic resonance imaging; ET, enhancing tumor; WT, whole tumor; TC, tumor core.

