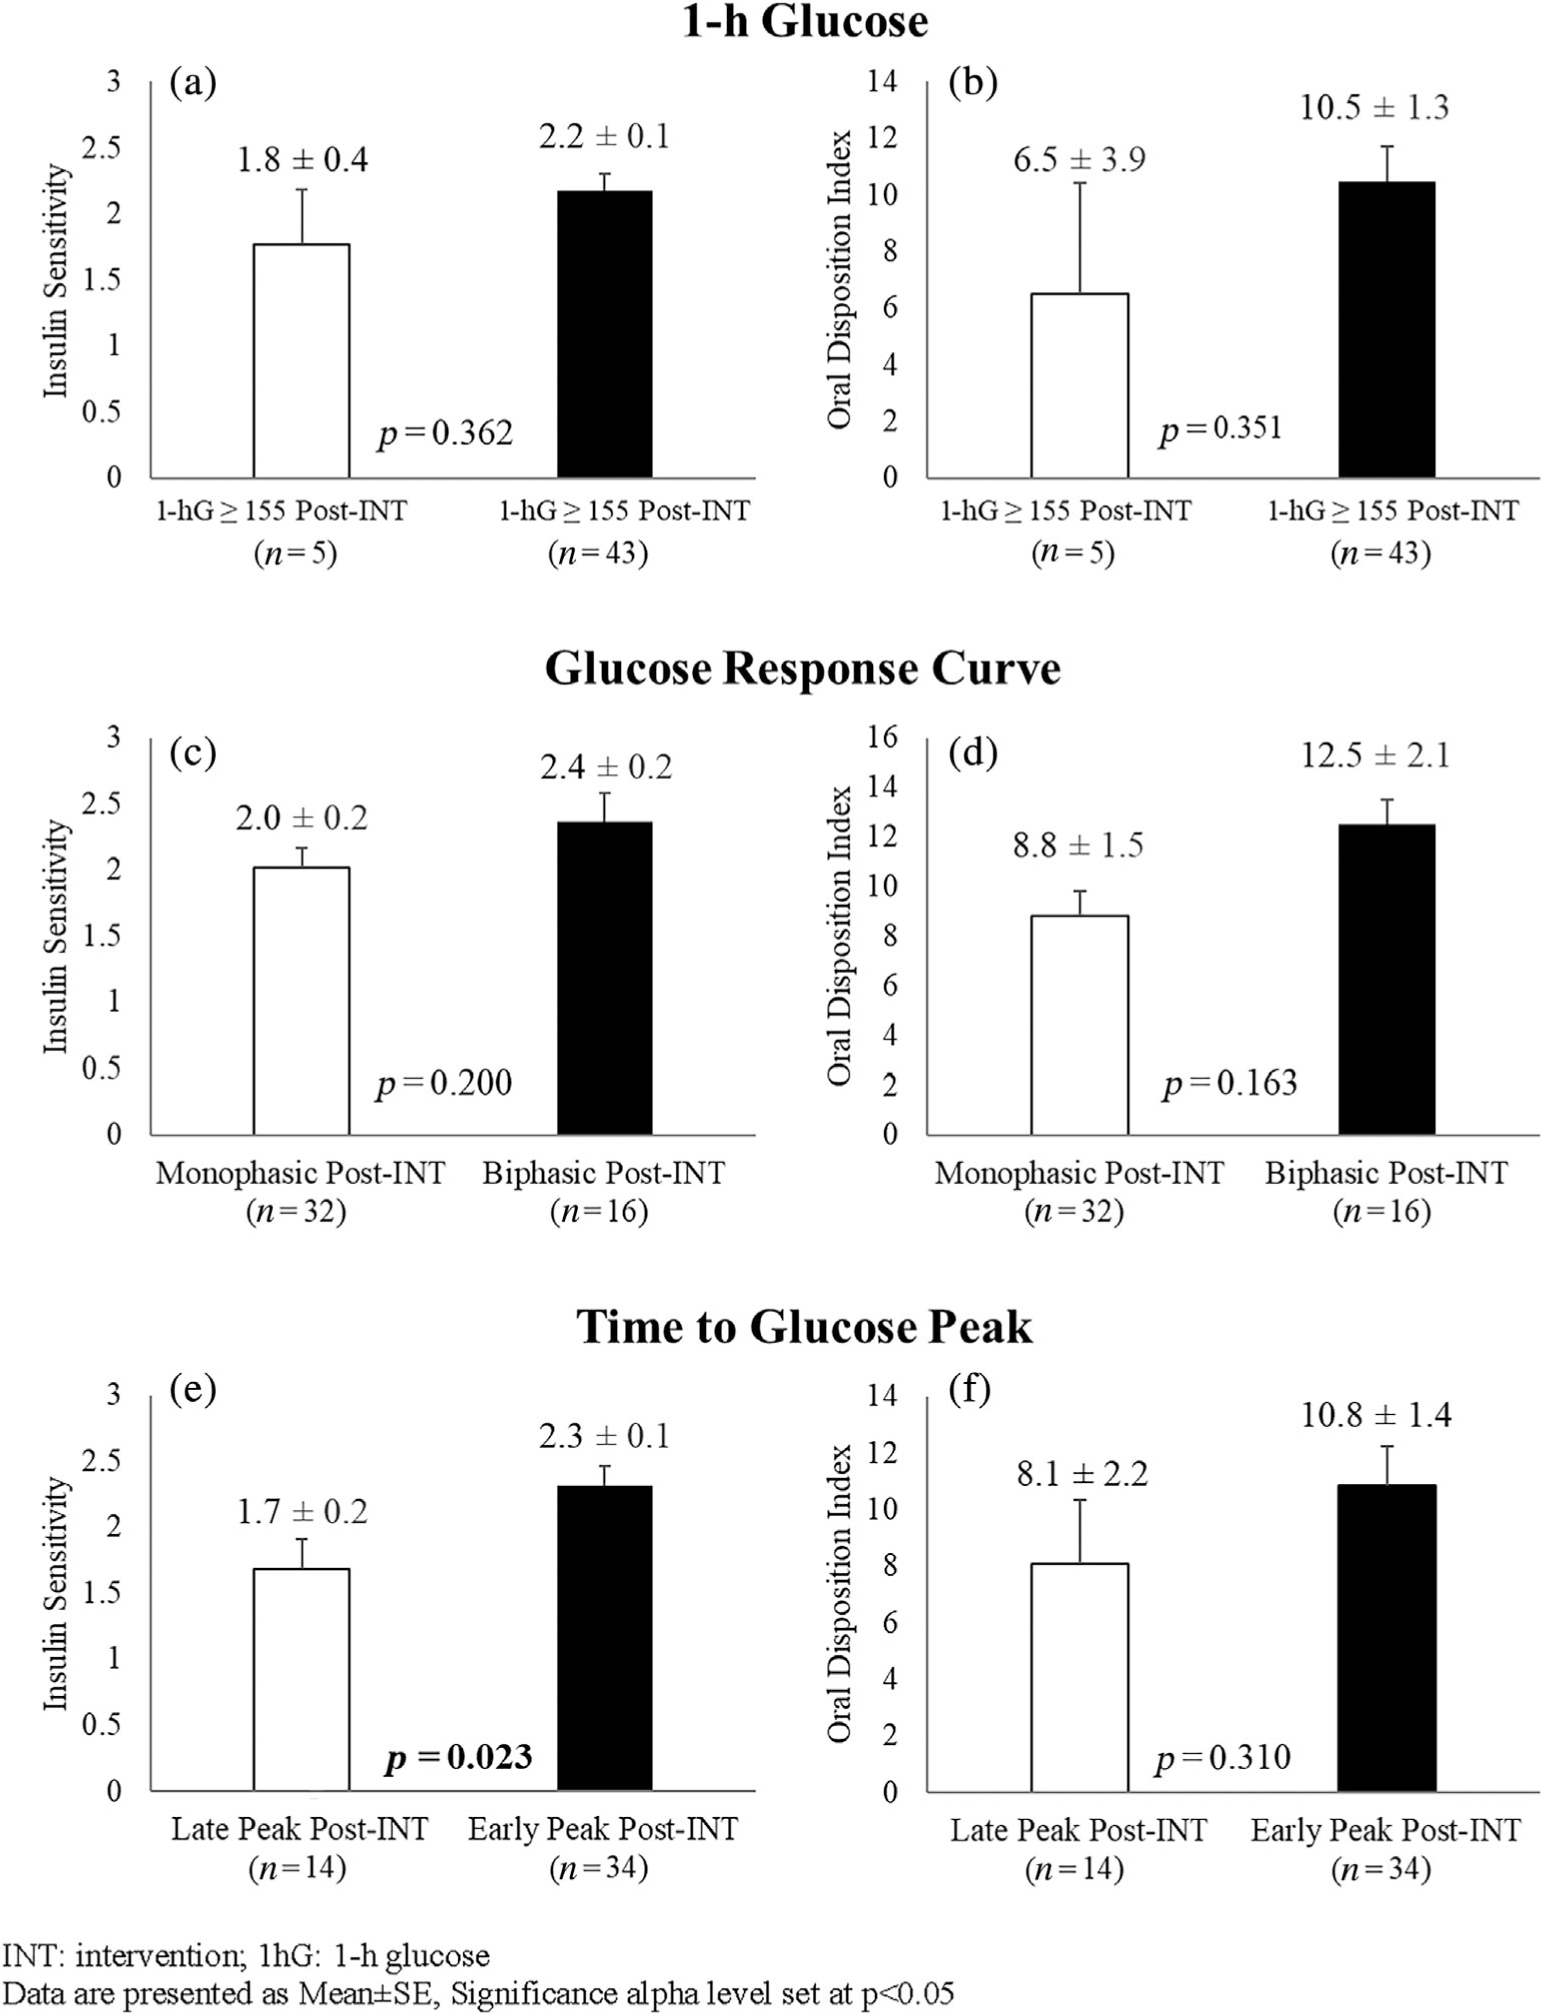
FIGURE 3.

Differences in insulin sensitivity by WBISI (Panels A, C, E) and β-cell function by oDI (Panels B, D, F) between respective OGTT-glucose phenotypes after intervention (Post-INT). INT, intervention; 1hG, 1-h glucose. Data are presented as mean ± SE, significance alpha level set at p < 0.05
