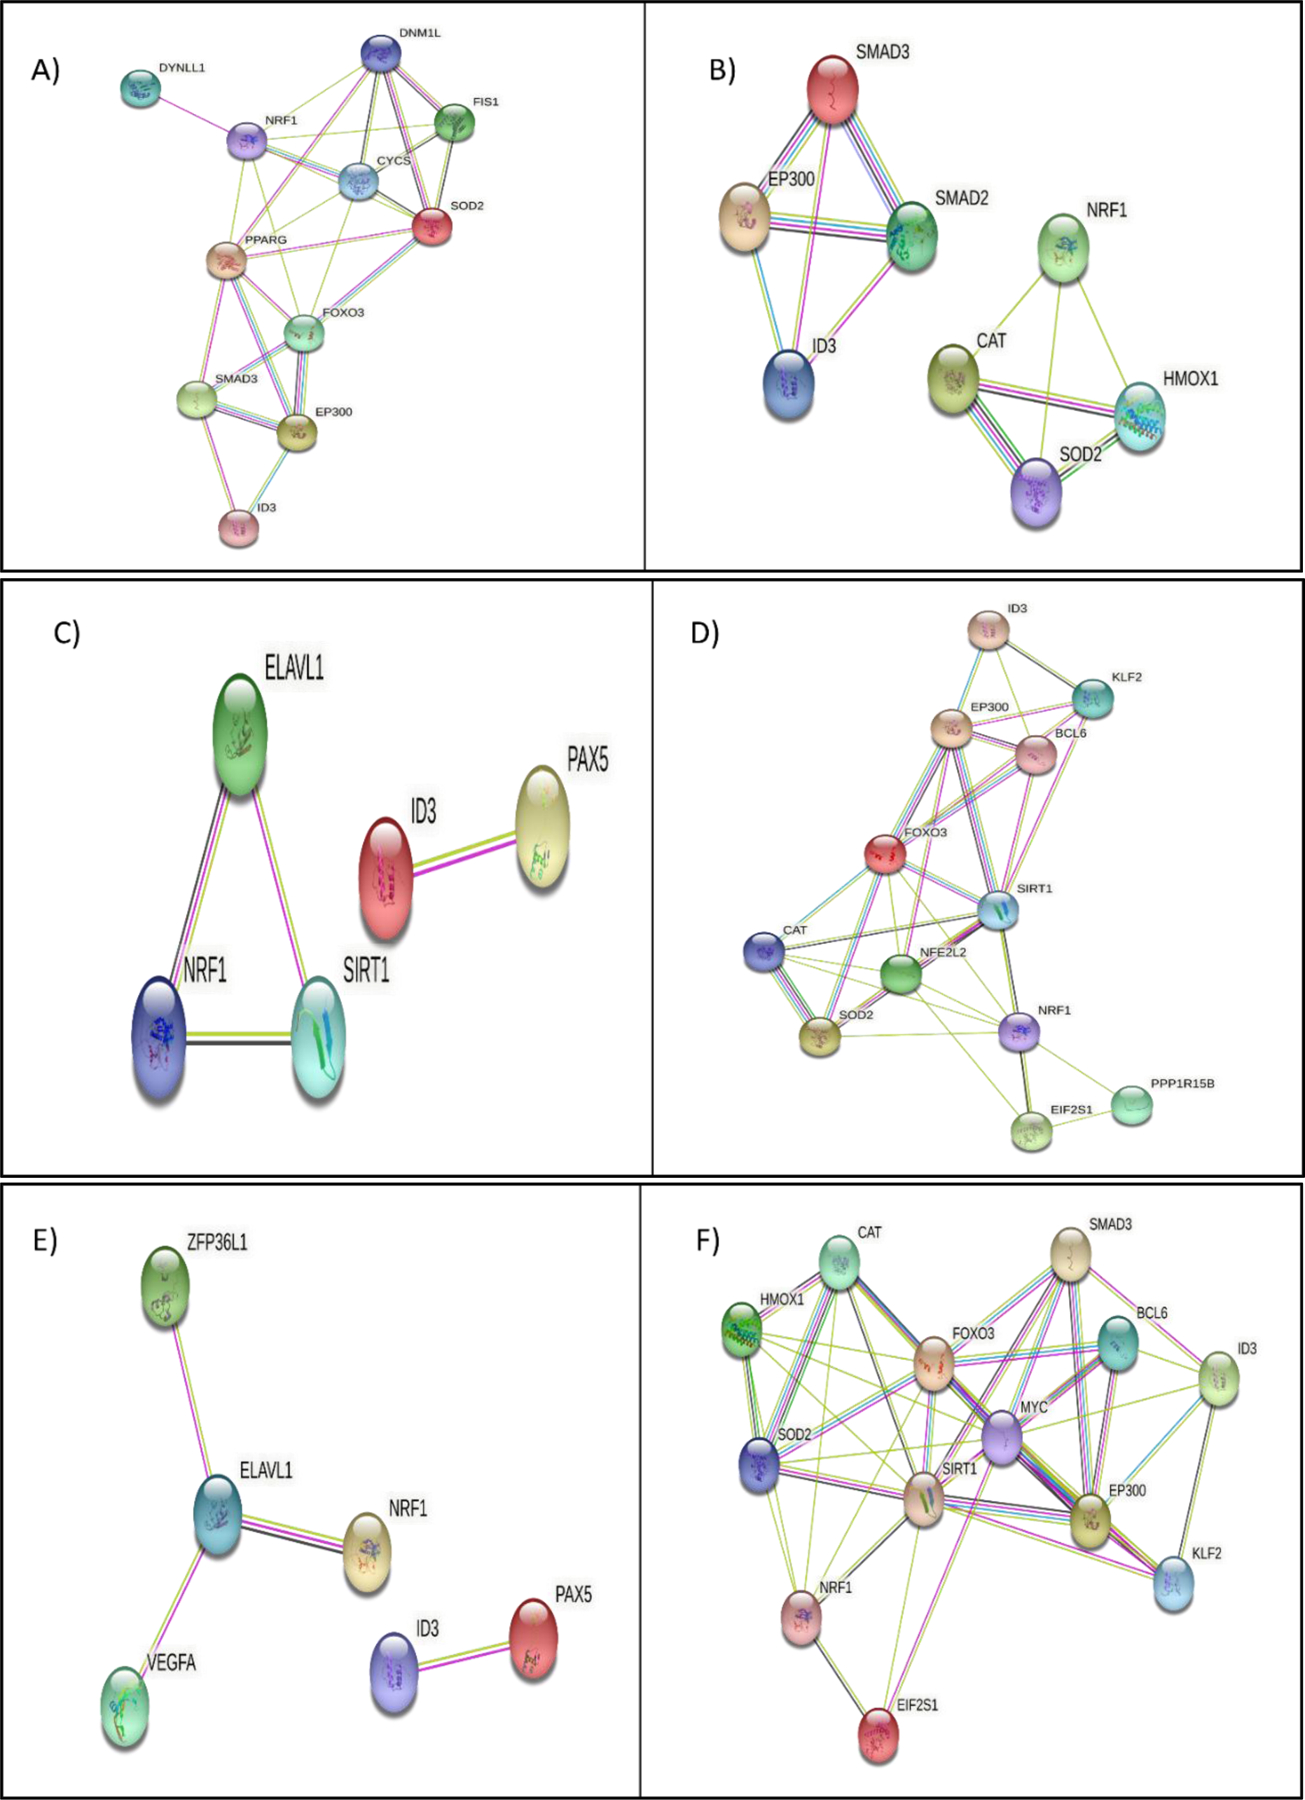
Figure 6.

Molecular pathway analysis of NRF1/ID3 joint gene targets. A) String Interaction of 11 NRF1 and ID3 shared ENCODE target genes (DYNLL1, DNM1L, NRF1, FIS1, CYCS, SOD2, PPARG, FOXO3, SMAD3, EP300, ID3) directly connected network derived from the BINGO apoptosis pathway (p-value = 0.01 in Hypergeometric Benjamini & Hochberg False Discovery Rate (FDR) test. B) String Interaction of 8 NRF1 and ID3 shared ENCODE target genes (SMAD2, SMAD3, EP300, ID3, NRF1, CAT, HMOX1, SOD2) directly connected network derived from the BINGO cellular macromolecular complex assembly pathway p-value = 0.000004 in FDR test. C) String Interaction of 5 NRF1 and ID3 shared ENCODE target genes (PAX5, ID3, ELAVL1, SIRT1, NRF1) directly connected network derived from the BINGO DNA Repair Pathway p-value =0.000000007 in FDR test. D) String Interaction of 12 NRF1 and ID3 shared ENCODE target genes (ID3, KLF2, EP300, BCL6, FOXO3, SIRT1, NFE2L2, CAT, SOD2, NRF1, EIF2S1, PPP1R15B) directly connected network derived from the BINGO cellular response to stress pathway (p-value = 0.0000000001 in FDR test. E) String Interaction of 6 NRF1 and ID3 shared ENCODE target genes (ZFP36L1, ELAVL1, VEGFA, NRF1, ID3, PAX5) directly connected network derived from the BINGO regulation of RNA stability pathway (p-value = 0.01 in FDR test. F) String Interaction of 13 NRF1 and ID3 shared ENCODE target genes (CAT, HMOX1, FOXO3, SOD2, NRF1, EIF2S1, SIRT1, MYC, SMAD3, BCL6, EP300, ID3, KLF2) directly connected network derived from the BINGO regulation of cell cycle pathway (p-value = 0.00000000007 in FDR test. Network nodes represent proteins. Edges represent protein-protein interactions. Interactions in blue represent known interactions from curated databases and interactions in magenta represent experimentally determined interactions. Green interactions represent predicted interactions of gene neighborhoods. Red interactions represent interactions involved in gene fusions. Blue interactions represent gene co-occurrence. Yellow interactions represent text mining determined protein interaction. Black interactions represent co-expression. Light blue interactions represent protein homology. Disconnected nodes showed no protein-protein interaction.
