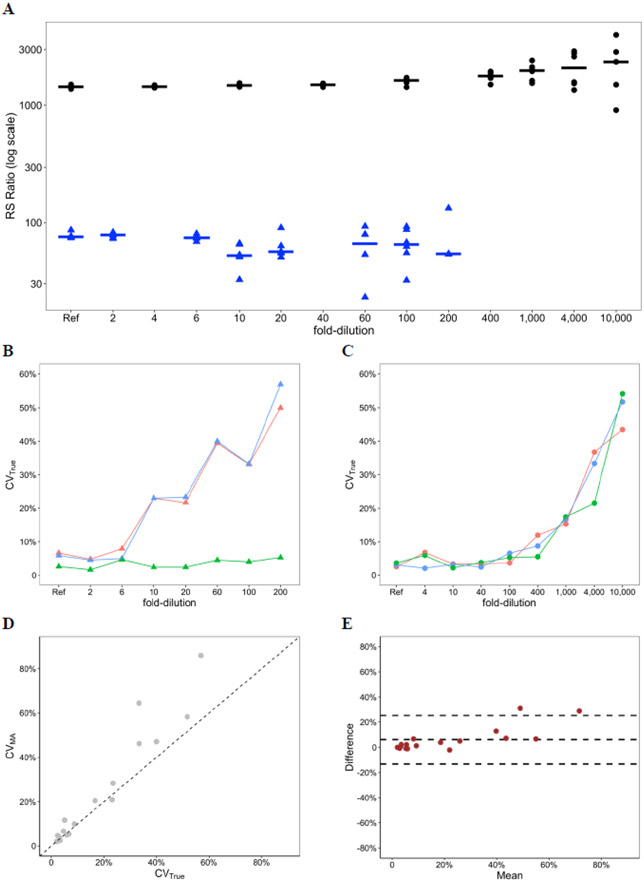
Fig. 1. Evaluation of CVMA as alternative for CVTrue in dilution series.
A, RS ratio results in a dilution series of a human sputum sample with high RS ratio (black circles) and a sputum sample with low RS ratio (blue triangle). For the low RS ratio sample, variability increased at a lower level of dilution than for the high RS ratio sample. Horizontal lines show median. B, Precision of the low RS ratio sample in dilution series. For the low RS ratio sample, precision of the RS ratio (blue) was primarily driven by precision of the numerator, (i.e., pre-rRNA, red). 23S rRNA (green) was relatively less variable. C, Precision of the high RS ratio sample in dilution series. For the high RS ratio sample, precision of the RS ratio (blue) depended on precision of both the numerator (i.e., pre-rRNA, red) and the denominator (i.e., 23S rRNA, green). D, Correlation between CVMA and CVTrue in both dilution series. A scatterplot showed a strong correlation between the two variables (Pearson correlation = 0.96). The 45-degree diagonal dashed line is a reference line that shows perfect equality between the two variables. E, Agreement between CVMA and CVTrue in both dilution series. A Bland-Altman plot showed a high agreement between CVMA and CVTrue. The middle dashed line represents the bias (mean difference) between CVMA and CVTrue. The upper and lower dashed lines represent the 95% limits of agreement.

