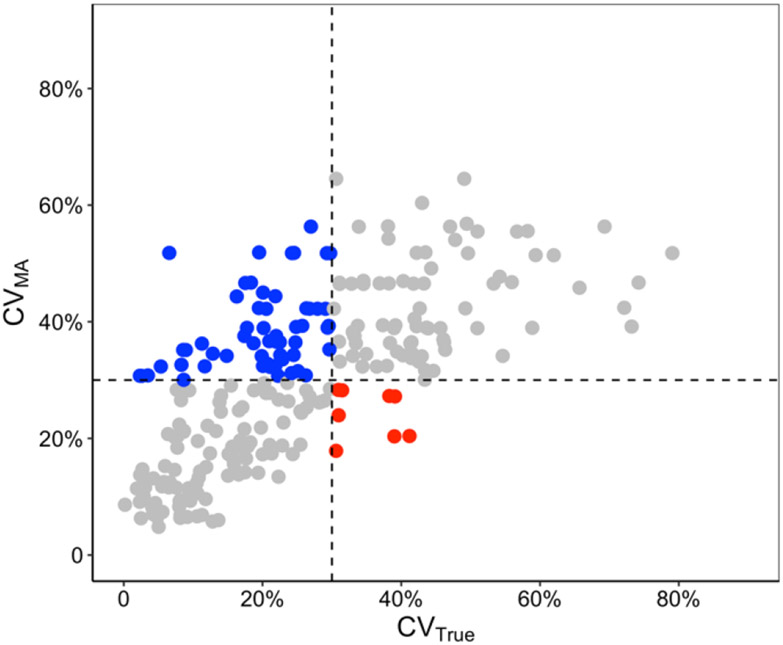
Fig. 3. Classification of routine assays based on CVMA and CVTrue.
Red and blue dots represent false positives and false negatives, respectively. Gray dots represent true positives (bottom left quadrant) and true negatives (top right quadrant). Dashed lines indicate 30% thresholds for both CVMA and CVTrue. The proportions of false positive, false negative and correctly classified samples are 9%, 35% and 74%, respectively.

