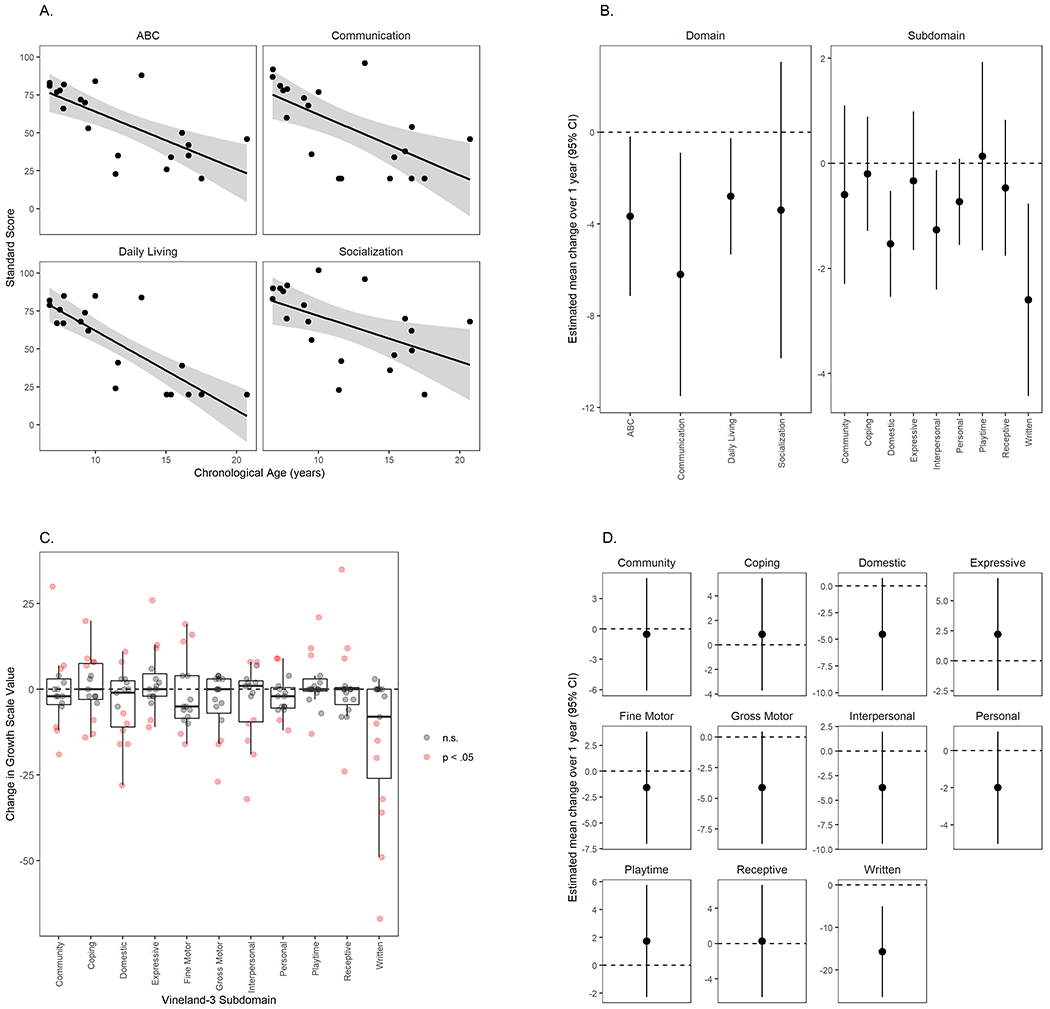
Figure 2.

Adaptive behavior scores at baseline and 1-year follow-up in individuals with CLN3-related disorders. A. Cross-sectional relationship (baseline only) of Vineland-3 adaptive behavior composite and domain scores to age (n=20, excluding vision-only participants). Line: fitted curve for CLN3. Circles: individual data points. Shaded area: 95% CI. B. Model-estimated mean within-subject change over 1-year follow-up in Vineland-3 domain (standard) and subdomain (V-scale) scores (n=15, excluding vision-only participants). ABC: adaptive behavior composite. C. Within-subject change over 1-year follow-up in Vineland-3 growth scale values in CLN3 disease (n=15, excluding vision-only participants). Change scores were compared to the manual-based average SEM for each subdomain, and values that exceeded 2*SEM are shaded pink. D. Model-estimated mean within-subject change over 1-year follow-up in Vineland-3 growth scale values in CLN3 disease (n=15, excluding vision-only participants). Score of zero represents no change in ability; negative scores indicate a decrease in ability.
